App Conversion Rate in App Stores: Why It Matters for Mobile Growth and ASO
The app conversion rate in app stores refers to the percentage of users who download an app after visiting its listing. It measures the effectiveness of the app's store page, including visuals, descriptions, and user reviews, in persuading visitors to install the app. Higher conversion rates reflect successful app optimization strategies.


For mobile app managers, conversion rates and app conversion optimization are the areas where they focus most of their marketing efforts. The reason for this is the crowded app market: as of August 2024, the App Store hosted roughly two million apps, with Google Play offering even more—around 2.3 million apps, according to Statista.
It’s no wonder that, to help an app withstand such fierce competition and improve conversion rates, app marketers have to take continuous iterative actions. Read on to learn how conversion rates are defined, which product page elements require special attention, and how app conversion optimization works.
What is the app conversion rate?
A conversion rate in app stores refers to the percentage of users who perform a desired action, going from point A to point B in the user journey funnel. Unlike absolute numbers, the percentage provides a clear understanding of the progress over time: the higher the conversion rate, the better the performance.
To calculate the app conversion rate, divide the number of users who completed the action by the total number of users who had the opportunity to complete it, and then multiply by 100%:
Conversion Rate = (No. of conversions / Total visitors)*100%
What is app conversion rate optimization?
App conversion optimization is the ongoing process of increasing the percentage of users who perform the desired actions. These actions can vary depending on which part of the user journey funnel you focus on for your optimization efforts.
For example, you can concentrate on user engagement and app retention within an app. Optimization actions aim to increase the percentage of users who complete onboarding, sign up and fill out the registration form, upgrade from a free trial to a premium subscription, make purchases, or engage with specific features within the app.
However, many aspects of the user journey funnel require improvement even before an app is downloaded. The app should capture the users’ attention in the app stores and be presented in a way that convinces users to add it to their home screens.
In this context, conversion rates measure how effectively users are converted to take specific actions on the App Store and Google Play.
How does app conversion rate optimization fit into your ASO strategy?
App conversion rate optimization on the App Store and Google Play involves various actions that app marketers take to increase the proportion of users who view an app’s page and then download it. Before we dive deeper into specific conversion rates, let’s understand why conversion rates are important for app store optimization (ASO).
As mentioned earlier, competition in both major app stores is fierce. One of the cornerstones of an app’s success in this crowded marketplace is visibility. App marketers improve visibility by optimizing keyword rankings and through featuring and paid ads on the app stores.
But can this visibility convert users into downloads?
The App Store and Google Play pay special attention to conversion rates, keyword rankings, and top charts. They aim to offer quality content to their visitors, and higher conversion rates tell the stores’ algorithms that users find an app appealing. As a result, they can rank the app higher as a quality product.
It’s also true that if conversion rates drop, visibility will also suffer. From the algorithms’ perspective, lower conversion rates indicate a failure to turn visibility in the app stores into user engagement and actual downloads.
Understanding conversion rates on the App Store and Google Play
Although conversion rates for Apple App Store and Google Play optimization are generally the same, several essential considerations affect app analytics.
These data are reported as impressions on the App Store. However, impressions include product page views unless you filter them by “Source Type.”
Google Play does not report impressions, only the store listing visitors (equivalent to Product Page Views on the App Store). As a result, we don’t know the exact number of users who saw an app in search results or elsewhere in the store. Only after a user lands on the store listing does Google Play record it as a page view, using this metric to calculate conversion rates.
Due to the differences in the user journey funnels and reporting, conversions on Google Play and the Apple App Store shouldn’t be directly compared.
Google Play optimization focuses on store listing creative assets that encourage users to tap “Install,” as they do not see this button elsewhere in the store. Users who have already visited the app page are generally more interested in the app. It’s no wonder that conversion rates calculated based on these app page visits are likely to be higher than those for the App Store.
What conversion rate-related metrics are available in App Store Connect and Google Play Console?
Apple App Store
Click-through rate = Page views (unique) / Impressions (unique)
This conversion rate measures the percentage of users who landed on the app’s product page after seeing it anywhere on the App Store.
Product page views refer to the number of times users visit an app’s product page. If a user discovers the app in search and then visits the app page, two impressions are counted. By tracking “unique” metrics for page views and impressions, you can ensure each device is counted only once, providing undistorted data.
App page conversion rate = First-time downloads / Page views (unique)
This ratio measures the percentage of users who downloaded an app for the first time after viewing the app’s product page. By tracking first-time downloads rather than installs (as reported in App Store Connect), you exclude re-install data from your statistics.
Remember that this conversion rate may exceed 100%, as users can download apps from the App Store without visiting the apps’ product pages.
Install rate = First-time downloads / Impressions (unique)
This metric is typically referred to when they say “conversion rate.” It measures the downloads from new users who have seen the app anywhere on the App Store, based on unique devices.
Search conversion rate = First-time downloads / Impressions (unique), with the “Source Type” filter set to “Search.”
By configuring this filter in this way, you can get clean download data from the App Store Search without any paid acquisition data being blended in.
Google Play
The primary conversion rate to monitor for Google Play optimization is the Store Listing Conversion Rate, which indicates the percentage of users who installed the app after visiting its store listing page:
Store Listing Conversion Rate = Store Listing Acquisitions / Store Listing Visitors
Remember that you can measure the conversion rate by source – Search, Explore (traffic from featured sections and app categories), and Third-Party Referrers (paid acquisition).
These major app store optimization metrics are provided by the app stores. However, collecting this data for further analysis can be time-consuming, especially when running multiple ASO campaigns simultaneously.
AppRadar’s “App Store Performance Tracking” dashboard aggregates data from the Google Play Console and the App Store, allowing for easier monitoring of conversion rate changes and insights into primary traffic sources and top contributing countries
Factors that affect app conversion rates
Many factors can influence app conversion rates and optimization efforts. Let’s explore the most important ones:
- App creative assets. These are some of the most apparent influencers on conversion rates. That’s why app marketers put considerable effort into creating visually appealing assets that stand out from the competition and effectively communicate the app’s value proposition. We’ll delve further into app creative assets optimization later in the article.
- App category. The app’s category significantly affects conversion rates, as it determines the environment where the app is placed. The higher an app ranks within its category, the more visible it becomes to potential users, leading to increased downloads from Explore or Browse sources.
- Keyword rankings for target keywords. The app’s position for target keywords influences the amount of traffic directed to the app’s page, resulting in more potential organic downloads.
- App size. This factor can affect the decision to download the app, thus impacting conversion rates. The larger the app size, the greater the potential losses in the conversion rate from the product page view to downloads.
- Monetization model. Apps with paid downloads have significantly lower conversion rates than apps that are free to download.
- Ratings and reviews. In addition to being key factors in how app stores rank apps, ratings and reviews influence users’ decisions to download. Higher ratings (4 stars and above) and positive reviews indicate that the app can be trusted.
- Localization. A properly localized app page is more likely to convert more users in the respective country, as they can relate to the language and cultural context reflected in the app’s creative assets.
What is a reasonable conversion rate for apps in app stores?
Firstly, there is no universally good conversion rate for all the apps in major stores. A reasonable conversion rate depends on the app store, the app’s category, the country being analyzed, and other factors outlined earlier.
For example, according to AppTweak, the average conversion rate (First-time downloads / Page views) in the US App Store in 2024 was 25%. However, this metric varies significantly across different app categories. For example, the Navigation category had a conversion rate of 115.5%, while Photos & Videos had 60.8%, and Board Games had a low of just 1.2%.
In contrast, the average conversion rate on US Google Play in 2024 was 27.3%. The Auto & Vehicles boasted the highest average at 70.5%, whereas Board Games again recorded the lowest average at 7.3%.
Best practices for increasing app conversion rates
In your app store optimization strategy, the category-specific and generic benchmarks outlined above should serve as a reference point against which you can compare your app’s performance. One of the major recommendations for app conversion optimization is to set measurable KPIs.
Before you gather data to compare against these averages, consider the following strategies for effective Google Play and Apple App Store optimization.
Conduct in-depth ASO competitive research:
- Determine the value proposition you want to convey through your app’s creative assets. Study your users and delve into their reviews.
- Analyze what competitors are doing within and outside your category, as this can provide inspiration and insights into current trends. This step is essential for app marketers seeking to present their app as unique and distinguishable in the crowded marketplace.
- Keep up with the stores’ requirements, market trends, app store optimization best practices, and even global trends that may affect how users perceive your app’s presence in the app stores.
Build hypotheses.
This step is crucial to avoid making wild guesses about which app conversion optimization actions might lead to increases in specific conversion rates.
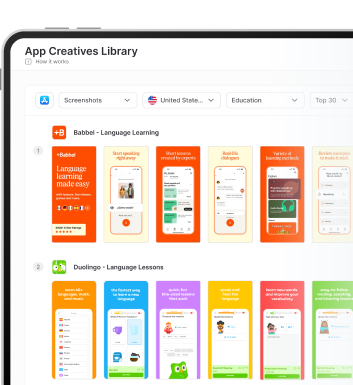
Optimize creative assets
According to research conducted by SplitMetrics, icons, screenshots, and videos can significantly impact app conversion rates. However, it is essential to consider the differences between the Apple App Store and Google Play and the user journey funnels in each store. The app’s creative assets contribute differently to the uplift in conversion rates:
| App creative asset | Conversion Rate uplift (%), App Store | Conversion Rate uplift (%), Google Play |
| Icon | 22.8% | 20.2% |
| Screenshots | 21.7% | 24.3% |
| Video | 16.6% | 17.4% |
Videos and screenshots on Google Play have a slightly higher impact on conversion rates than those on the App Store, while icons bring in more results for Apple App Store optimization.
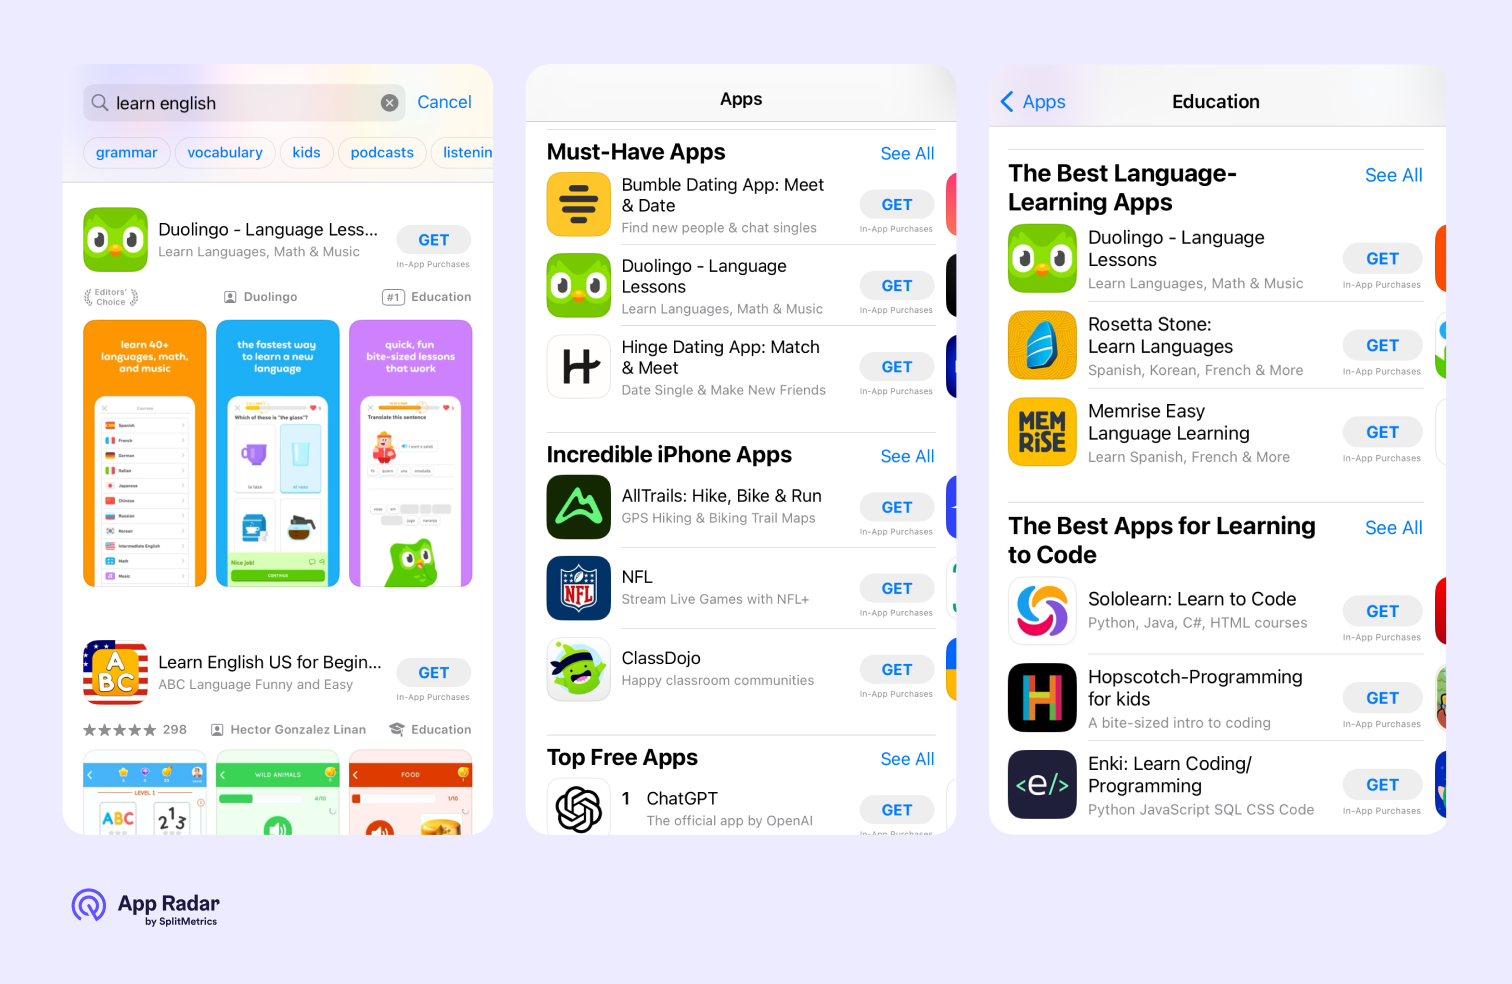
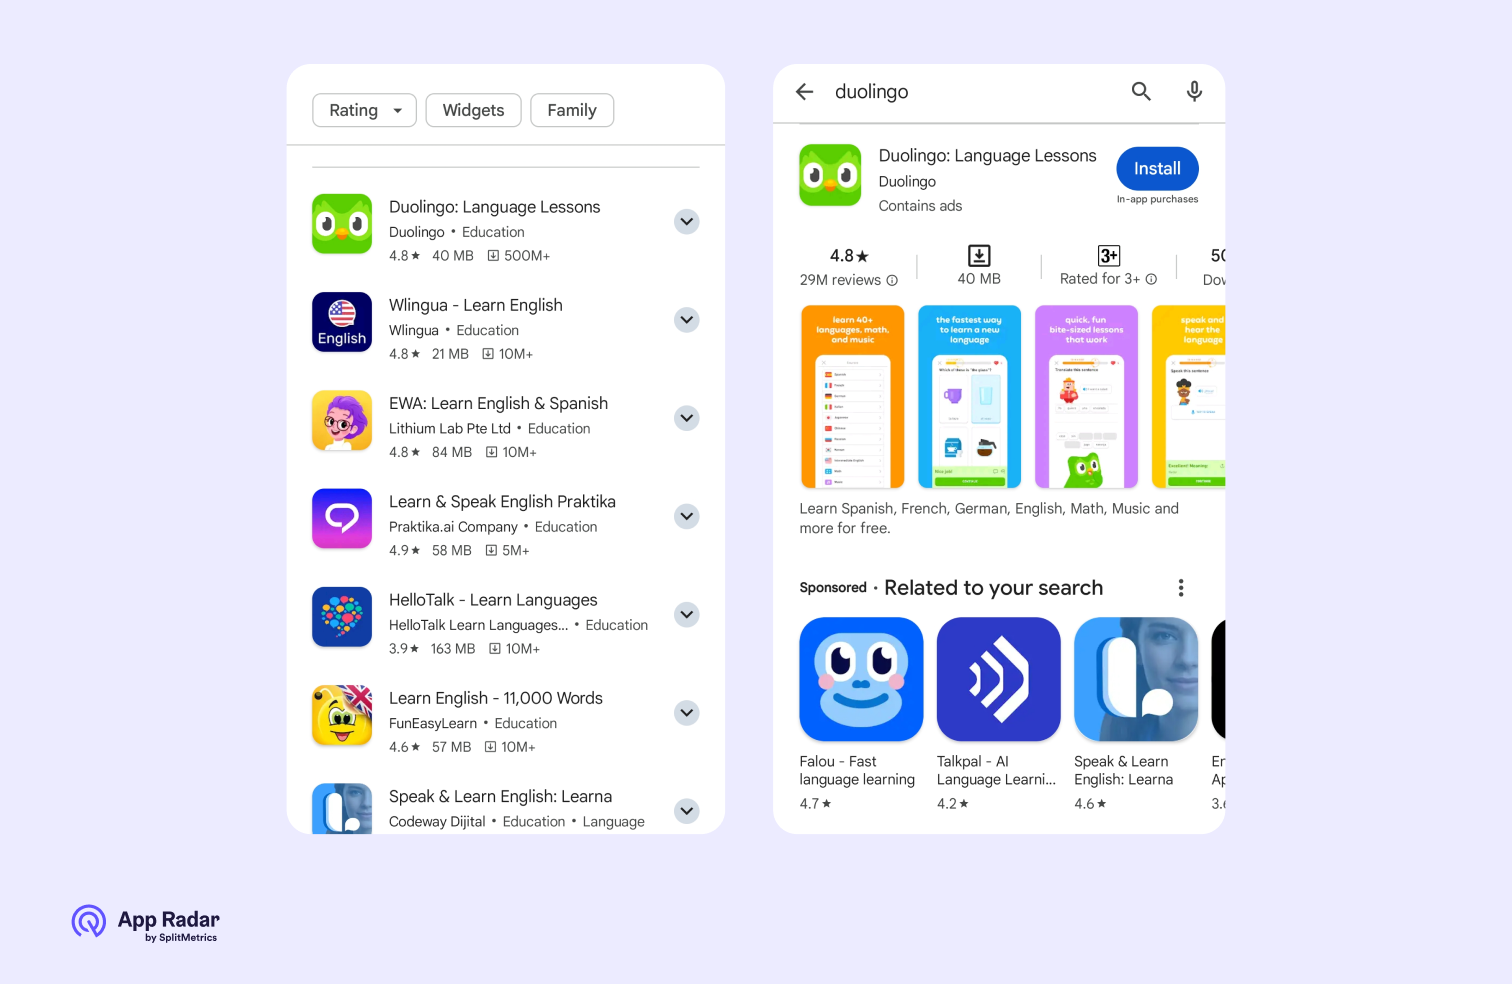
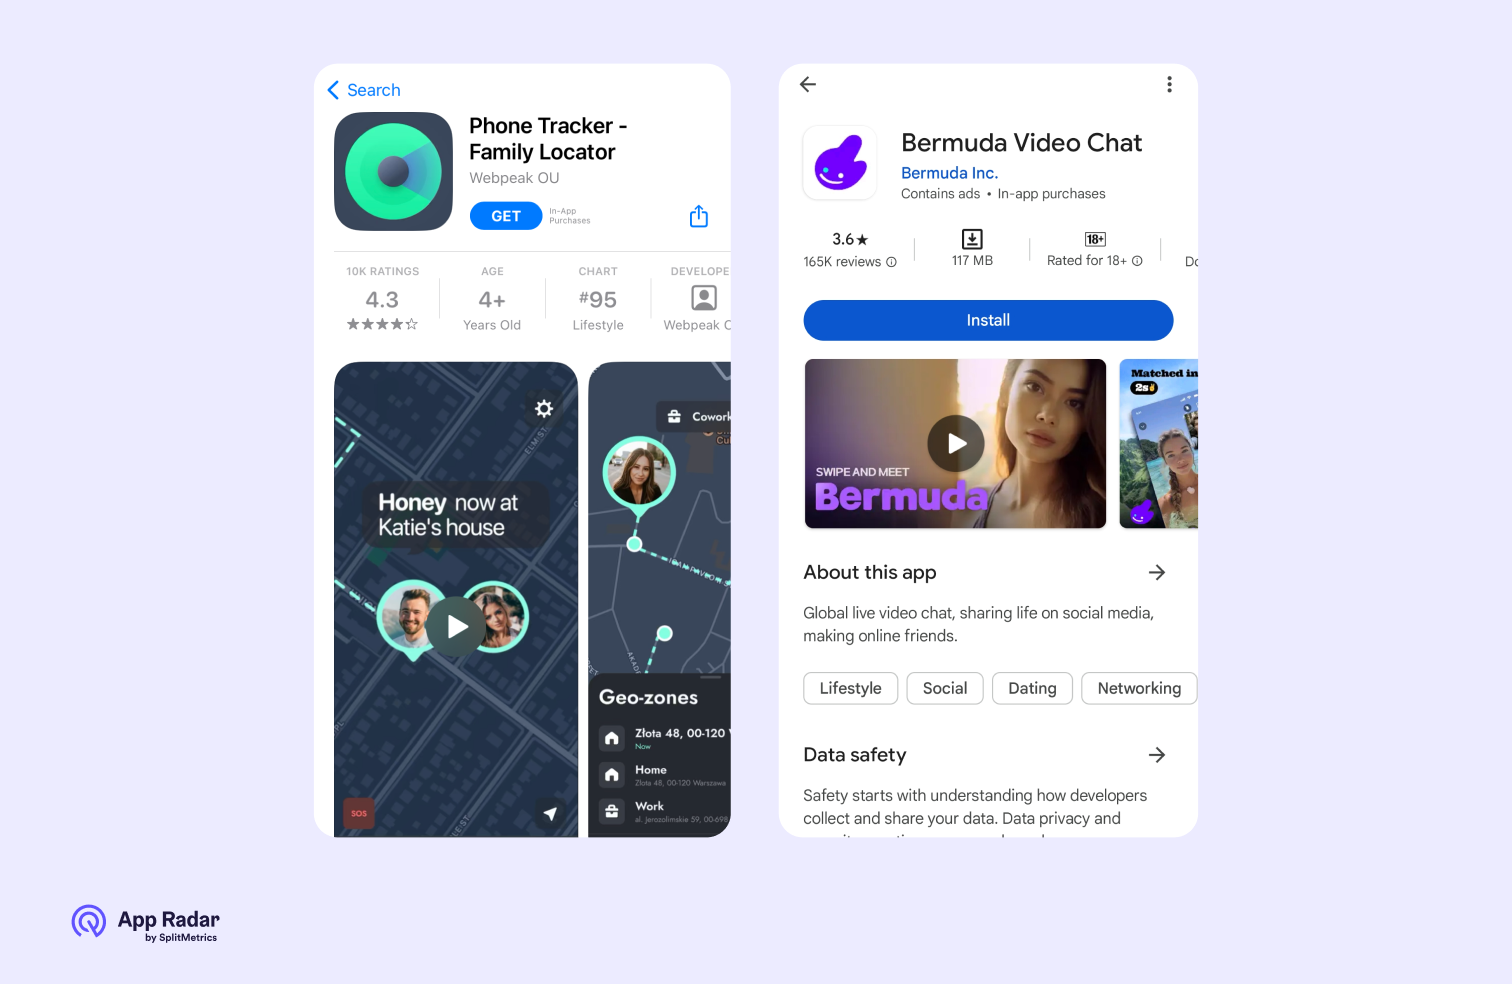
App Icon
This app creative asset is shown next to the “Get” button in the Browse sections of the Apple App Store, making it a crucial element for Apple App Store optimization. However, it is less impactful in search results than screenshots and videos.
In comparison, icons play a more significant part in Google Play Store optimization than in the Apple App Store. Firstly, this is the only visual element that appears in Google Play’s Search or Explore sections, and secondly, icons look much more prominent next to screenshots on the store listing page than on the App Store product page.

When optimizing an icon:
- Reflect your brand identity through colors and visual elements.
- Use the elements that hint at what your app is about.
- Consider designs used in your category, but try to stand out to capture more user attention.
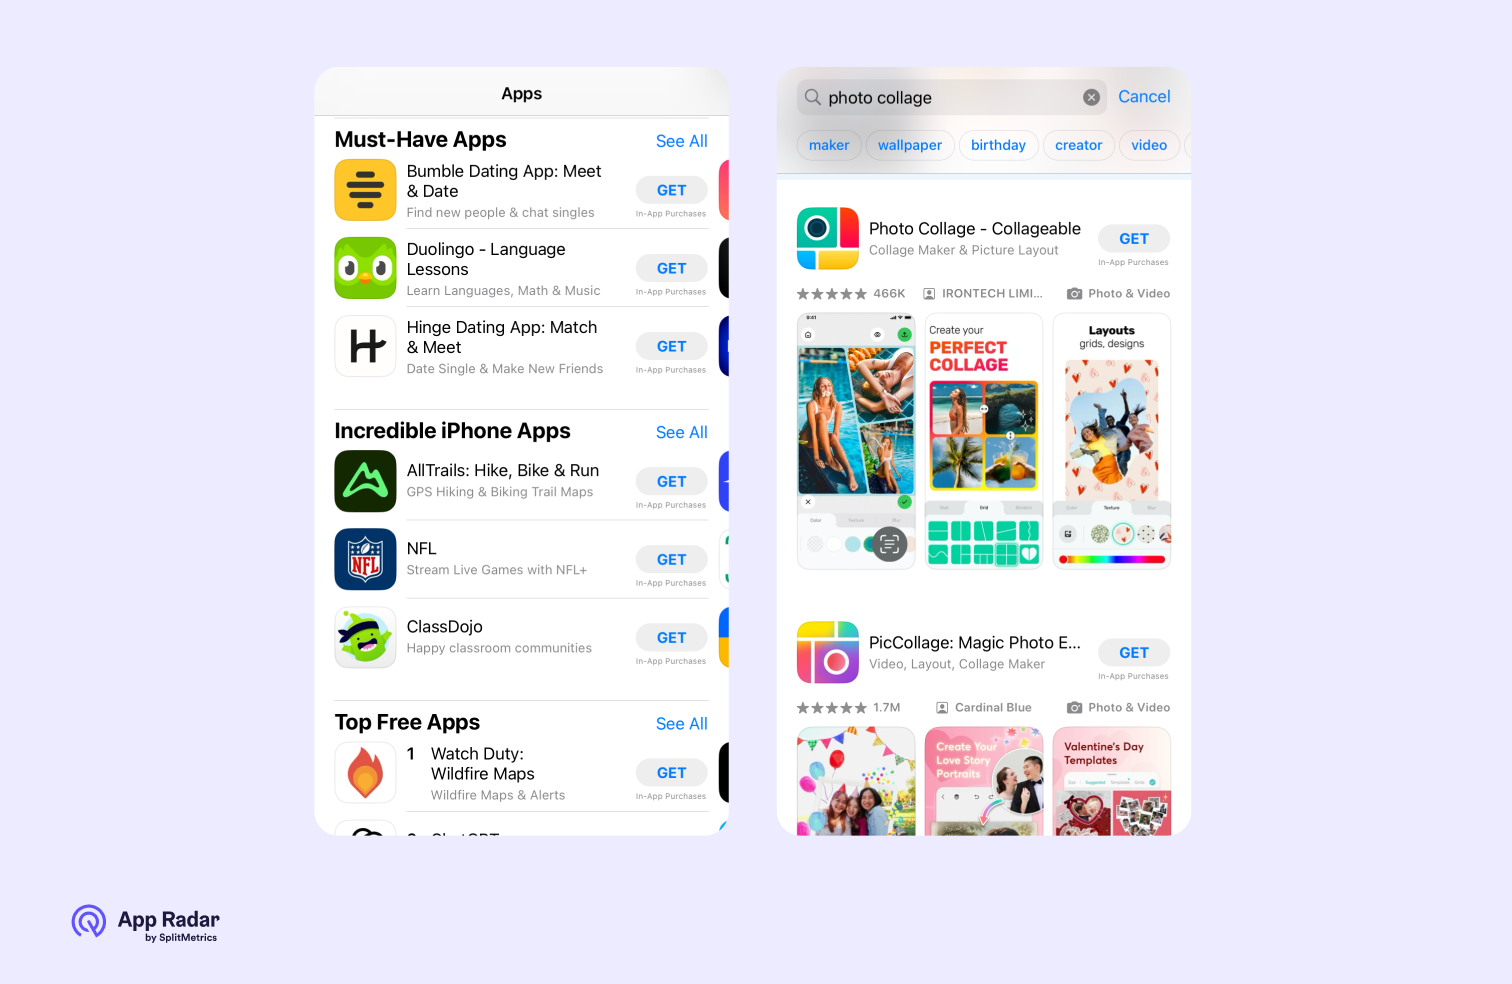
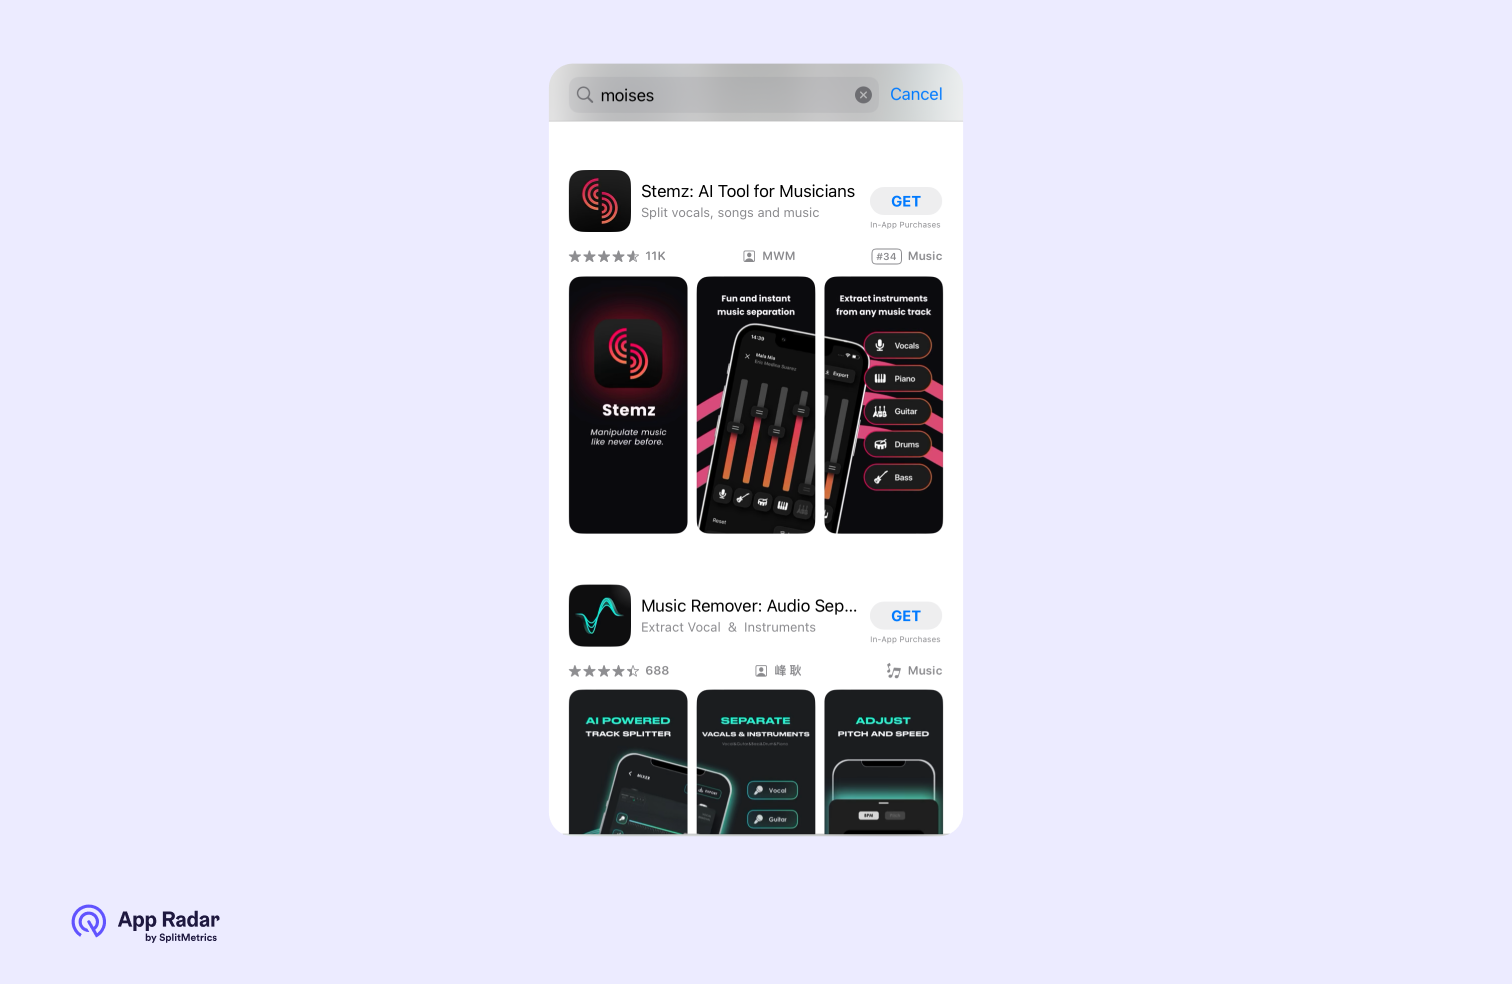
Screenshots
As for App Store optimization, focus on improving Search conversion rates (conversions from search into first-time downloads) by optimizing your screenshots. Three of them appear in search results, so it makes sense to place the most crucial information there:

As for the app page, screenshots are critical for both Apple App Store and Google Play optimization. Since different numbers of screenshots are visible to users without scrolling through the gallery, it makes sense to place the most important information first:

When optimizing screenshots:
– Ensure they are readable, clear, visually appealing, and unique. Use concise captions that effectively communicate your app’s value.
– In Google Play screenshots, focus on educating the user rather than on design elements.
Videos
The app preview video (App Store) and the Google Play promo video can tell a detailed story about your app. These videos are visible from the screenshots gallery instead of the first screenshot:
When optimizing your videos:
– Conduct competitors’ research to understand if the video is necessary. There are categories (Photo & Video, Health & Fitness on the App Store) where videos are commonly used. However, videos don’t always outperform screenshots, so careful consideration should be given before adding one to your app page.
– Add captions to the video for better perception, make it concise, and add the most valuable info at the beginning: users are unlikely to watch the video till the end.
App descriptions
Let’s delve into the text assets on both app stores.
Subtitle (App Store Only): This is a 30-character text that conveys your app’s value. Effective app store optimization will involve adding the right keywords to the subtitle to enhance visibility in Search and Browse.
Short Description (Google Play): This is an 80-character text that appears under screenshots above the fold. Use this space to encourage users to download the app and add relevant keywords to improve its ranking.

Long Description: While most users will rely on visual app creative assets, long descriptions are essential, especially for Google Play optimization, where keywords added to the text are indexed in search. There’s no indexing for Apple App Store optimization, but you can convey your app’s value more creatively. Pay special attention to the first three lines, visible under screenshots, before users tap “more.”
Try app localization
App localization is a big part of app conversion optimization for both stores. It helps increase organic conversion rates and downloads and reach global audiences. In addition to keywords, localizing app creative assets and text metadata is vital. This process goes beyond mere word-for-word translation.
Proper app localization considers cultural references, including locations, models, cultural symbols, national holidays, foods, and more.
Google Play offers an auto-translation feature that enables users to view text metadata with an automated translation if the app manager hasn’t uploaded a manual translation. Apple App Store doesn’t provide similar functionality.
In addition, custom store listings on Google Play offer extended localization opportunities. This feature helps to create up to 50 variations of the main store listing and reach audience segments in particular countries with localized, tailored messages reflected in in-app creative assets and texts.
Overall, the more resonating messages we show to specific audiences, the higher conversion rates we’re likely to achieve.
Manage ratings and reviews
App ratings and reviews directly impact downloads and app conversion optimization. Users often compare different apps when deciding which one to download, and an app with multiple negative reviews may struggle to compete and could lose installs. It’s recommended that reviews in the app stores be monitored and addressed, and insights for app improvement should be obtained from user feedback.

A/B test app creative assets
As previously mentioned, app conversion optimization is continuously improving app creative assets based on data and insights. If done correctly, A/B testing provides such data on conversion rates.
Things to consider for effective A/B testing:
- Implement one relatively significant change to the assets and check the performance against the main app page. Introducing multiple changes at once makes it difficult to attribute any conversion rate results to a specific app creative asset.
- Never draw conclusions based on A/B tests that are stopped prematurely or lack sufficient data.
- Schedule A/B tests during periods when no dramatic changes in traffic are expected, such as during seasonal fluctuations or aggressive paid acquisition campaigns.
A/B testing experiments can be conducted within the App Store and Google Play store listing experiments based on the store traffic and external platforms like SplitMetrics Optimize. These out-of-store A/B tests help optimize app creative assets without the risk of dropping conversion rates within the store.
Analyze the results of app conversion optimization
Everything mentioned above would be meaningless without this step. The major conversion rates outlined in this article must be collected to draw conclusions about your app conversion optimization efforts. You can gather the data from the App Store and Google Play by yourself to inform your further hypotheses, or you can use app analytics tools such as App Radar, which can compile this data for you and provide optimization insights.
Final Thoughts
App conversion optimization requires a holistic approach. There’s no single metric on which to focus, and there is no finish line for conversion rate improvements. App Store and Google optimization is an iterative and continuous process that should be backed by planning, hypothesizing, and analyzing changes in conversion rates data and app analytics over time.
Unlock AI-Driven ASO with App Radar
Start for FreeLatest Posts

Academy Lessons

Continue lessons
