ASO Benchmarks: Keep an Eye on Your Category Trends
We are excited to launch our new Metadata Benchmarks for ASO, a unique addition to the App Radar suite that sets a new standard in app market intelligence. This feature provides great insights that help you stand out in a competitive market.
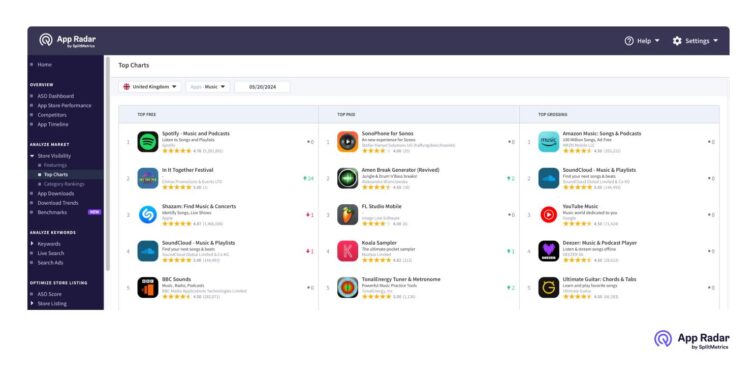
You can now easily access and monitor metadata and creative trends within any category with Metadata Benchmarks in the Analyze Market section for both the App Store and Google Play!
At SplitMetrics, we’re known for helping app businesses make data-driven decisions by providing extensive market intelligence, like our Apple Search Ads Search Results Benchmarks. Now, with this update, we extend our scope to ASO.
Understanding the Impact of App Store Metadata & Creatives
In the constantly changing world of mobile apps, App Store Optimization (ASO), alongside App Store Advertising, remains a powerful part of app marketing strategy. The core of ASO involves optimizing app store metadata and creatives, as well as conducting thorough competitor research. The strategic use of metadata, including app name, keywords, and visuals, directly influences an app’s visibility through rankings and conversion rates, resulting in a bigger (or smaller) amount of app store downloads.
Furthermore, one of the key benefits of relevant metadata and creatives is attracting relevant users to your store listing. It is not enough that your app is found – it has to be found by the right users. Creating a strong ASO strategy gets you the right users!
What are App Radar’s Metadata Benchmarks?
This feature extends App Radar’s capabilities around competitive intelligence. Besides exploring the Localizations & Creatives, Metadata, and Review Summaries of a specific competitor, you can now also access your category averages. This means you can understand how others in the category optimize their metadata and creatives for a specific region to stay ahead of the curve.
For instance, if you’re struggling with your app’s visibility in the Games category, our benchmarks can show you exactly how the top-performing apps use metadata and creatives to climb the rankings. Login to your App Radar account (or start a free 14-day trial) and go to section “Analyze Market”.
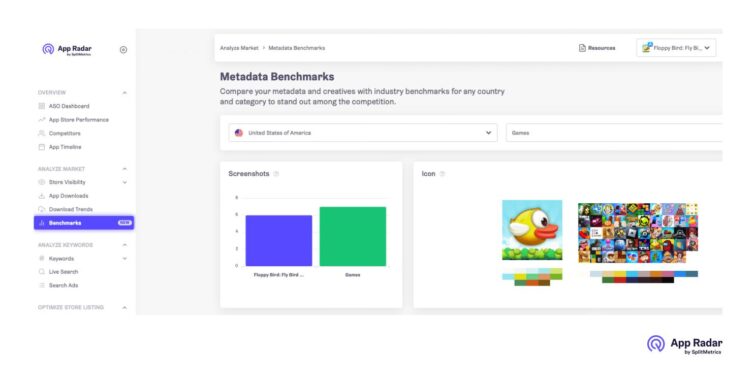
We love hearing from you! After trying out Metadata Benchmarks, let us know how it went. Your feedback helps us make sure our product is as helpful as possible.
You can access the data for Google Play Store and the App Store for any country and category for:
- Screenshots, icons, videos
- Description
- Number and distribution of ratings
Additionally, for apps on the App Store you can track:
- Promotional text
- App size
- In-App Payments
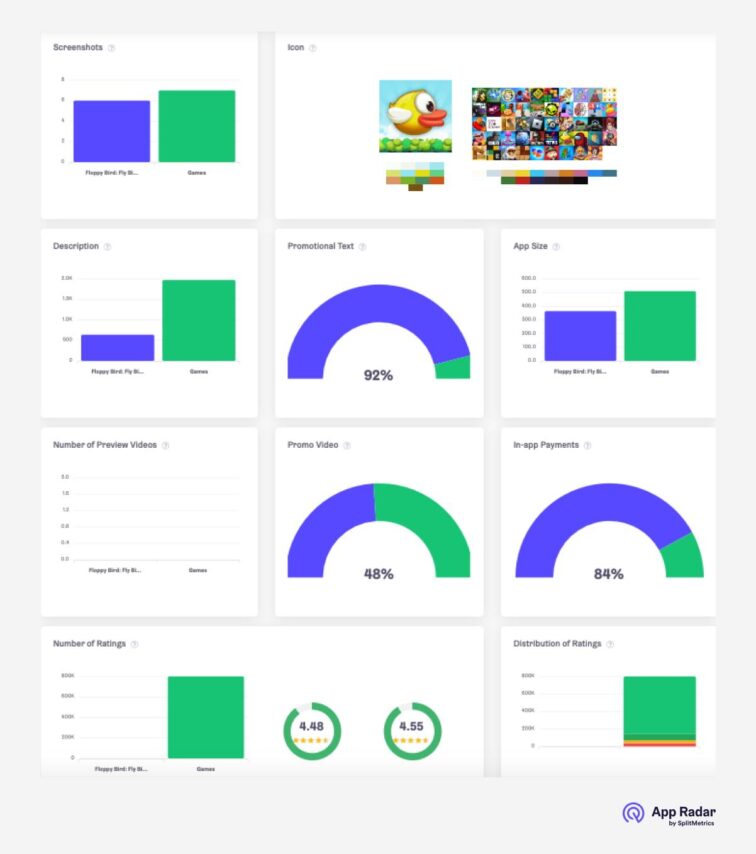
The feature is based on our data engine analyzing the top apps in any category to provide you with the most accurate insights. Our interface is straightforward and easy to use, allowing you to access category benchmarks quickly without any hassle. With this product update, you can be confident that the insights you gain are based on the latest industry trends.
No more juggling multiple tools and spending hours on manual research! Our platform simplifies your work by bringing all the ASO insights you need into one place, saving you time and effort. Why not give it a try with a free 14-day trial?
Data insights for Games Category in USA and Germany
To illustrate this feature’s power, let’s look at the Games category on the App Store in the United States and Germany in May 2024. The data clearly shows that promo videos, promotional texts, and in-app payments in the USA are used much more widely than in the German market. Apps also receive, on average, 9x (!) more ratings from Americans rather than Germans. At the same time, the average number of iOS screenshots and usage of promo videos is rather similar.
| Data point | USA average | Germany average |
| Description: Number of characters | 1,971 characters | 2,085 characters |
| Share of apps with promo video | 48% | 47% |
| Number of screenshots | 7 | 6 |
| App size | 510 MB | 463 MB |
| Share of apps with promotional text in category | 92% | 80% |
| Share of apps with in-app payments in category | 84% | 78% |
| Average number of ratings | 799,924 | 88,499 |
| Average rating in category | 4.55 | 4.33 |
| Ratings distribution | 81% of 5-star ratings | 78% of 5-star ratings |
Besides the mentioned features, App Radar’s Market Intelligence also includes:
- App Timeline (incl. In-App Events)
- Amount of Downloads per publisher/app
- Review Summaries
- Top Charts
- Category Rankings
- Competitor Creatives, Metadata and Localizations
- Featurings, and more
Armed with this wealth of information, you can make strategic decisions about your app’s store listing to outperform your competition in different countries. Whether it’s adjusting the number of screenshots or fine-tuning your icon, the power is in your hands!
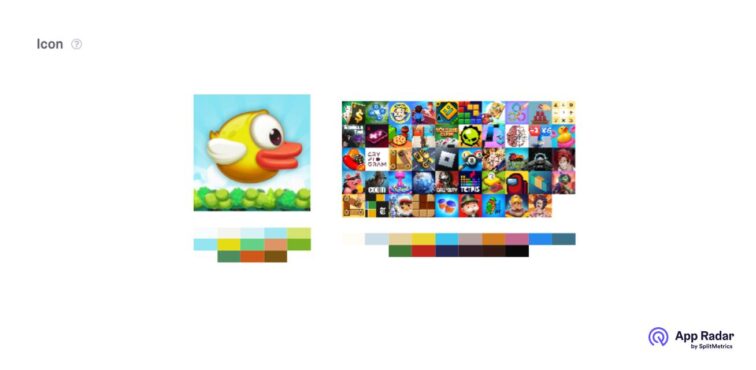
Also, exploring app icon trends within the category is now significantly easier. The example below shows the most common color palettes used by Gaming apps in the USA for iOS.
In the fast-paced world of mobile apps, having a competitive edge is crucial. App Radar keeps you informed about your competitors and category trends and provides the tools you need to act on that information swiftly. Check out your category metadata benchmarks today by logging into your account and going to the “Analyze Market” section, or get started with a 14-day free trial today!
Keyword Intelligence, Market Intelligence, Competitor Insights.
We have all the data to help you pick the right organic ranking strategy.

Latest Posts
iOS App Product Page Localization: How to Use it the Right Way to Improve ASO
Top 10 Most Downloaded Games in Google Play Store (July 2025 Update)
Google Play Store Listing Experiments: How to Run Native A/B testing for Android Apps for Free!
12 Best Mobile Measurement Partners (MMPs) to Consider for Your Mobile App Attribution in 2025
Related Posts
