6 Mobile App Metrics You Absolutely Need to Measure
If you’re new to the mobile app industry or just published a new app, then this article is for you. There are so many app and mobile metrics to track. But, taking the time to measure these values and analyze the results will give you the overview of your app’s current success and act as a guide for app growth strategies. However when you’re new to this whole app business, the large list of metrics can be a bit overwhelming.
Don’t stress too much because I’m about to break it all down for you. Let’s start with the 6 app metrics you definitely need to measure as an app industry newcomer.
1. Active App Users
Active users are usually tracked within the following segmentations:
- DAU: Daily Active Users
- MAU: Monthly Active Users
DAU is the amount of people using your app at least once a day and MAU for at least once month. These values allow you to determine how sticky your app is. Are people coming back to your app and how long do people wait until they come back?
Stickiness
A stickiness value is calculated by dividing DAU by MAU. The higher the value, the better stickiness your app has.

Stickiness also includes engagement. Are people using your app and all its features? In order to figure this out, track your active users’ activity. Take note of how long their sessions are and exactly which features they’re using in those sessions. By observing active users’ behavior, you’ll see which features are used the most. The ones that are used most are the ones that are helping your app’s stickiness, bringing people back.
Are you working with subscription apps? Then check out these key metrics to monitor the success of your subscription app.
2. App Retention Rate
Retention rate is how many people are still using your app after a certain period of time. A high app retention rate is always a good thing. It means people enjoy your app and find it useful for any said part of their life.
If you see that your app retention rate is low, then you know it’s time to figure out why people are leaving. You can do this by tracking user behavior and pinpointing the exact in-app situations that may have prompted an uninstall or app abandonment. You’ve identified a high priority fix when a pattern appears, such as many people uninstalling right after an app crash or abandoning when presented a login page.
Measure retention rate for weekly, monthly and quarterly periods to identify both short term and long term retention issues.
Retention rate is calculated by dividing the number of installs in a given time period by the number of active users in a give time period.

Churn Rate
The inverse of retention rate is your churn rate, the percentage of users who stop using your app within a certain time period.
According to Localytics, 71% of app users churn within 90 days. If you’re struggling to keep your app retention rate up consider adjusting factors such as, app on-boarding, in-app and push notifications, intro tutorials, email marketing, social media marketing and more. All of these factors have the potential to largely affect a user’s app experience and their likelihood to churn.
3. App User Acquisition Cost
User acquisition cost, more commonly known as customer acquisition cost (CAC), is the price you paid to obtain a new user. If you spend $1000 in user acquisition efforts and you obtained 100 users, then your CAC is $10 per user.
Calculating the CAC for every user acquisition campaign you launch enables you to measure the success of that campaign on a financial level.

The goal is to decrease CAC.
One method of decreasing CAC is to gain app users organically, without paid methods. Cultivating organic growth isn’t always the easiest thing, I know. But, there are multiple strategies that help increase organic user acquisition.
Try utilizing social media to boost brand awareness and create hype around your app. Organic growth also comes from app store optimization (ASO), the process of increasing app visibility in the app stores. When you want your app to rank high in the app store searches, ASO is what you need to be doing. The process includes optimizing app title, description, icons, screenshots and more. Another way to bring in organic users is referral. Remind your active users to invite their friends. Rewarding both the inviter and the invitee, gives both parties great incentive to install your app.
As of 2017-2018, the average app CAC for installs is 2.89 USD and 4.58 USD for account creation across all app categories.
4. App Installs
Speaking of installs, installs are simply how many people are installing your app within a certain time frame. Installs may seem like a surface level metric that doesn’t provide much information. However, knowing how many installs are completed during a certain time frame and where these installs are coming from is very useful for your app growth strategy.
Sources that bring in more installs, are proven. You can continue using these outlets and scale them for further growth. Sources that bring in less installs need improvement. This is where you would go in and see why these sources are not working as well as they should. How can you adapt your strategy to turn these sources into more effective ones? Always be flexible when it comes to app growth.
The tech world changes fast and if you’re not willing to change with it, you’ll get left behind.
Always be flexible when it comes to app growth. Stay up to date with tech advancements and take advantage of them as soon as you can.
Tracking installs also means tracking uninstalls. When you have more uninstalls than installs, you have a problem. Go back to your app and figure out what’s making people leave. Setting up focus groups and sending out surveys are great ways to find out directly from your target audience exactly what they want.
5. App Engagement
Engagement is so important because it tells you if your users are actually using your app. That’s what you want your users to be doing right? Having them really interacting with your app, taking advantage of all the functions you worked so hard on developing and coming back regularly.
App engagement encompasses a few metrics, which are all trackable with Google Analytics.
Session Length
Session length runs from the point where a user opens the app to where a user closes the app. It’s how long users are inside of your app, utilizing its features. The longer a session length, the more you user is engaging with your app.
Session Interval
Session interval is the time between a user’s app sessions. It’s well related to app stickiness. Session interval shows you how much a user loves your app or how addicting your app is. Large session intervals means users are not coming back to your app very frequently. Short session intervals signify the opposite, users are constantly returning to your app.
Screen Views and Engagement Flow
Screen views and engagement flow are highly important when it comes to knowing your users’ behavior. They reveal exactly how a user is going through your app.
Are users staying on one page longer than other pages? Do most users flow from one specific page to another specific page? At which page do users tend to exit the app?
Screen views and engagement flow answers all of these questions. Knowing your users’ movement through your app enables you to identify both effective and problem areas.

Source: Google Analytics
Events
For a more detailed look into your users engagement, track events. Events track all user actions, including interactive and non-interactive. An app feature is enjoyable or useful when it’s engaged with frequently. From this you can determine which features keep and build upon and which ones to improve, bring attention to, or remove.
Social Interaction
Social media is now inseparable from society. Tracking what people are sharing and where people are sharing from your app, enables you to see which parts of your app have virality and community building potential. Thus, encouraging users to share your app will ramp up its growth.

Source: Google Analytics
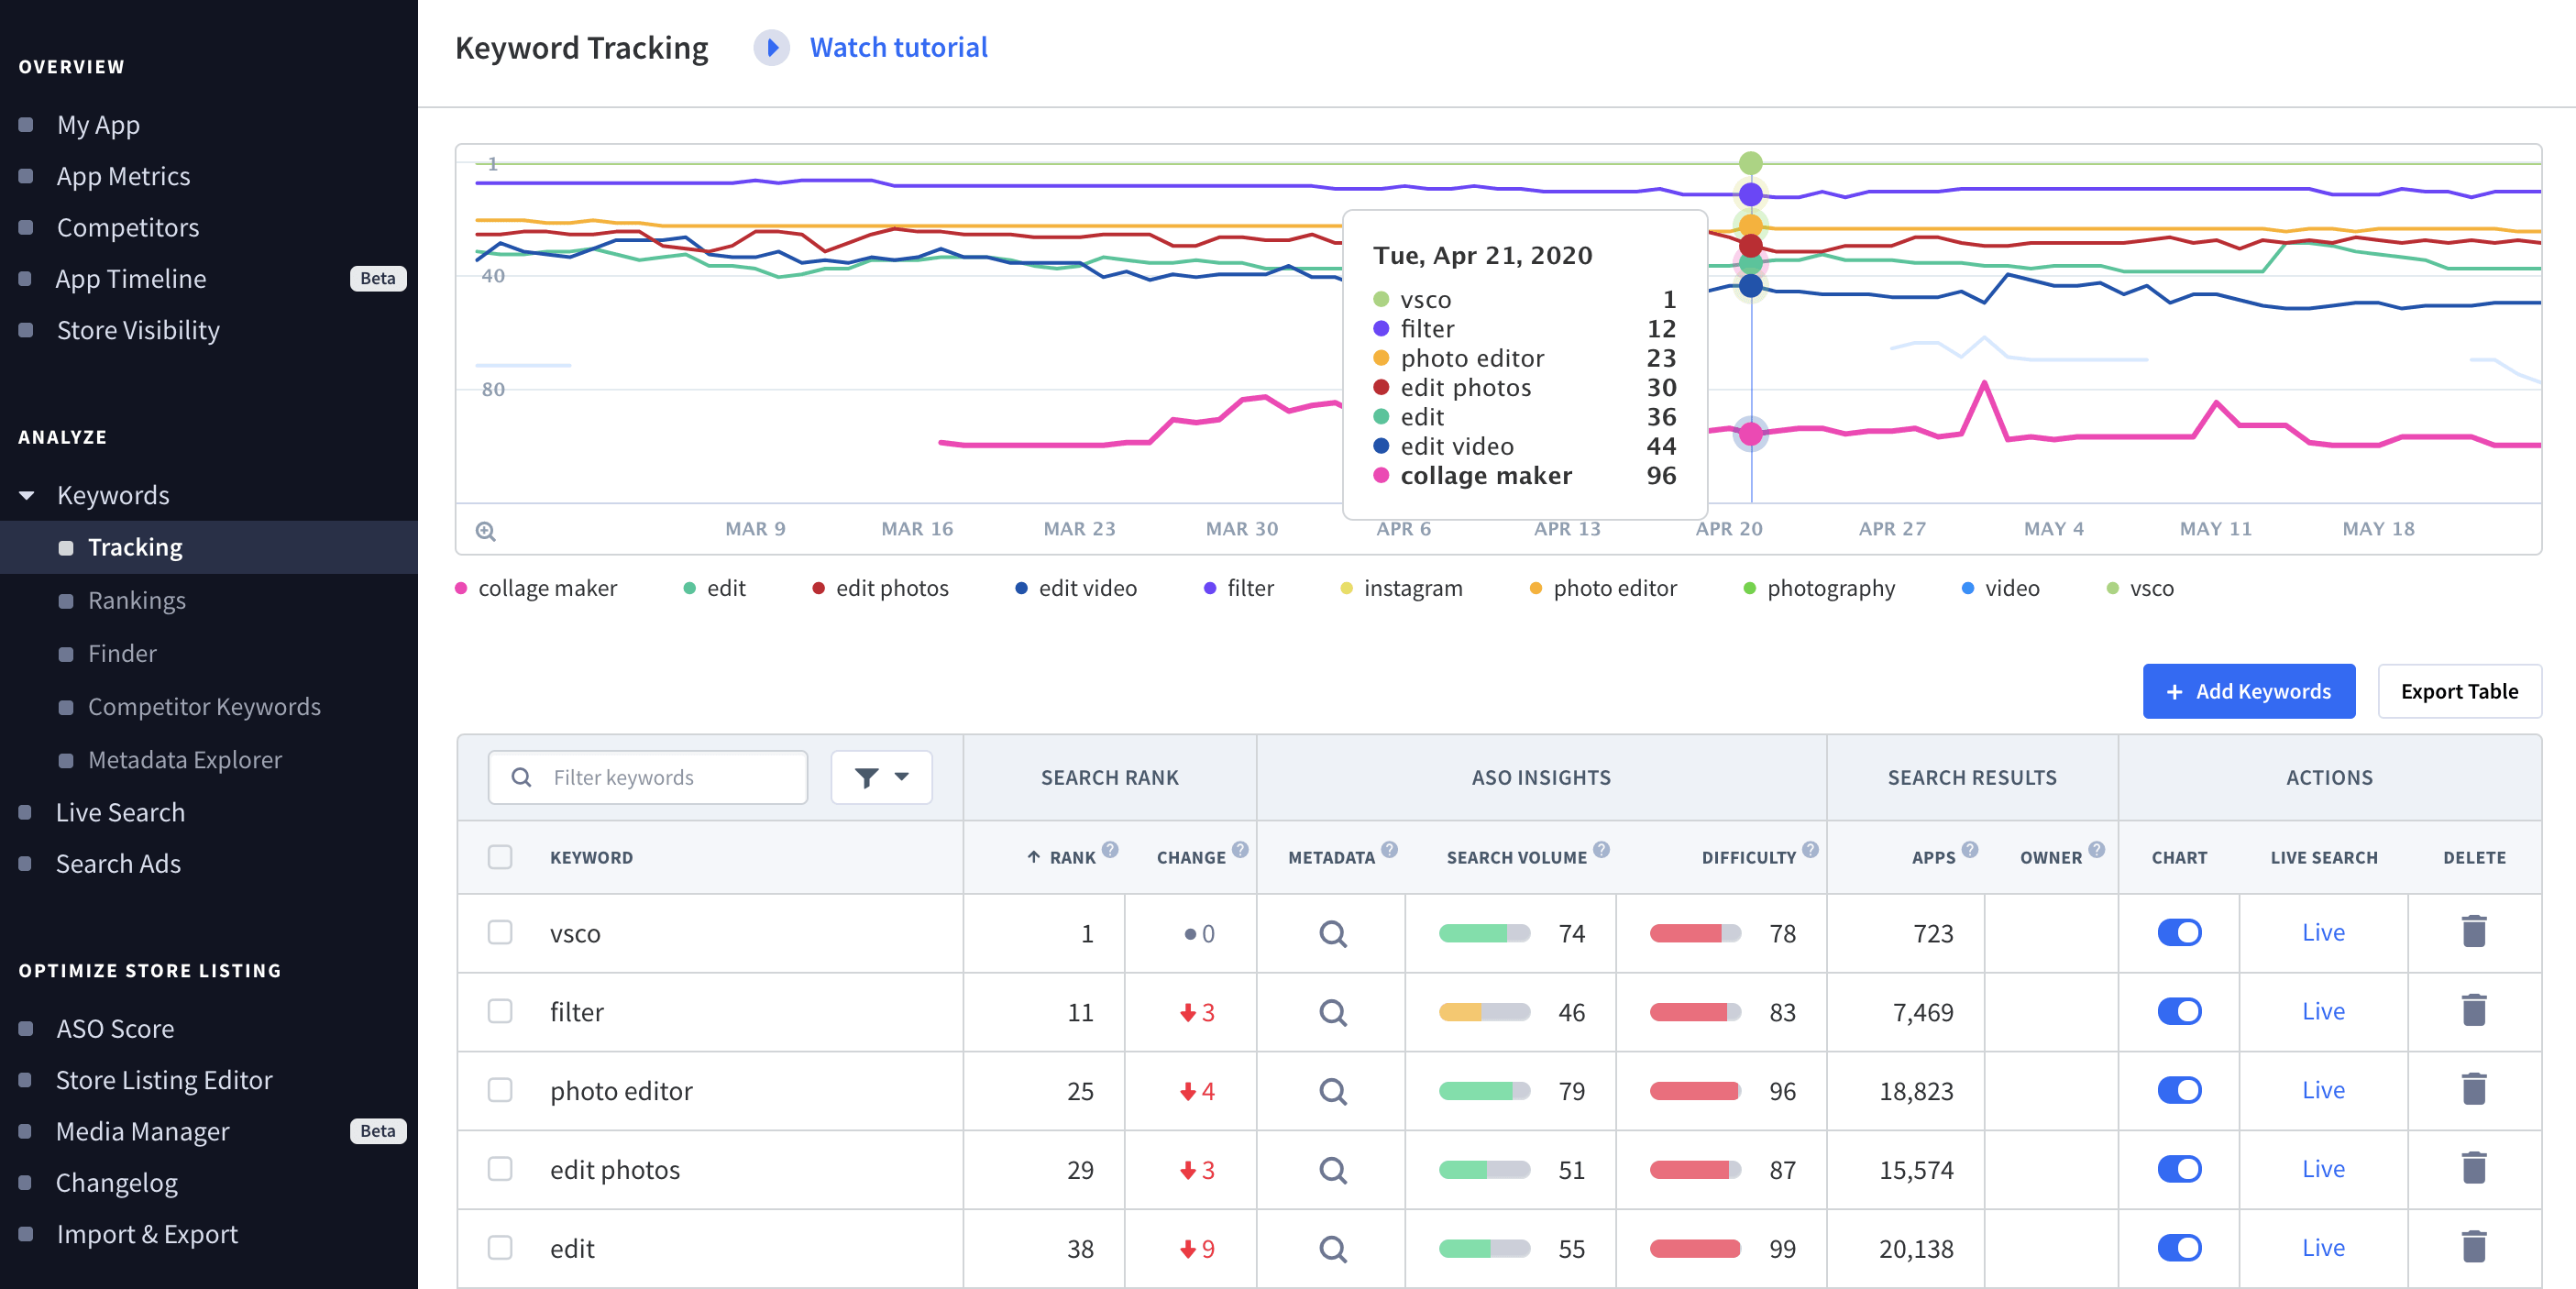
6. App Store Rank
App stores use an algorithm to order their search results, meaning apps ranking higher for certain keywords or search terms show up higher in the search results. App store rank is whether your app ranks for a keyword and if so in what rank position. Not only does app store rank affect your app’s position in search results but it also affects whether your app gets put into the top charts or featured apps. So what exactly determines app store rank? I already mentioned this earlier, ASO. ASO, which again stands for App Store Optimization, is how you get increased visibility for your app.
You can check out your ASO health score, how well your app is optimized for the app stores, with App Radar’s FREE ASO Tool.


The ASO factors that influence app store rank are:
- App Title
- App URL
- App Subtitle
- App Description
- Keyword Field
- App Icon
- App Screenshots
- In-App Purchase
- Ratings and Reviews
- Backlinks
- Installs and Engagement
- Updates
ASO is an ongoing process considering that app stores are constantly analyzing new and old apps. The app stores want to give their customers the most relevant results and the best apps. Get your app in the top rankings by continuously improving not only the quality of your app but also the its ASO.
Keyword Intelligence, Market Intelligence, Competitor Insights.
We have all the data to help you pick the right organic ranking strategy.

Latest Posts

How to Launch an App in 2026 and Succeed: an Overview of Costs, User Acquisition and App Store Requirements
The best mobile game engines for iOS and Android in 2026
Ultimate ASO Checklist
iOS App Product Page Localization: How to Use it the Right Way to Improve ASO
Related Posts

12 Best Mobile Measurement Partners (MMPs) to Consider for Your Mobile App Attribution in 2025
How Watch Duty Became the #1 Wildfire Tracking App on the App Store
Top 10 Most Downloaded Photography Apps on Google Play - December 2024
Best money management apps 2022
Featured Posts