The ultimate guide to App Store Connect for app marketers and publishers
If you want to succeed with your app store optimization (ASO) and paid user acquisition efforts with iOS users, you must know how to properly use App Store Connect. Being the second-largest app store in the world (after Google Play Store), App Store Connect offers a unique set of features that app marketers can use daily to improve their KPIs and increase their downloads.

What is App Store Connect?
App Store Connect (historically known as iTunes connect) is Apple’s platform for releasing, managing, and reporting iOS mobile apps. While Google Play Console is the central place to work on the apps for Android devices, App Store Connect covers devices with the iOS system, which includes iPhone and iPad products.
Similar to Google Play Console, the users of App Store Connect can be divided into two major groups:
- App developers that need to provide software updates and technical releases and comply with Apple’s guidelines to successfully launch their app
- App marketers and ASO teams want to optimize and monitor the performance of their apps in different countries to achieve high ratings and downloads.
If you are in the early stage of your app in Apple’s App Store optimization or are a seasoned ASO professional, this guide will explain best practices for working with App Store Connect. We assume that you already have an app in the App Store and are now ready for the next steps. If you don’t, please refer to Apple’s official documentation first, as you will primarily benefit from this article if you can follow along.
After reading this guide, you should better understand how Apple’s platform works and use this knowledge to improve your ASO game.
App Store and most important key performance indicators
If you are starting with optimizing your Apple App Store listing, you should know the key performance indicators or KPIs you need to track to measure your app’s success.
App Store operates differently than Google Play. The KPIs you track in the App Store have different definitions than those in Google Play. For a start, the users in the App Store can download an app from the App Store search results without landing on the app’s product page. Because of that, your KPIs need to reflect the actual behavior of your users.
We suggest you use the following KPIs for measuring your App Store performance:
- Click through rate = Unique page views / unique impressions. Use this KPI to measure App Store impressions’ success in bringing people to your product page.
- App page conversion rate = First-time downloads / unique page views. Using this ratio, you can see how well your product page converts and brings downloads. The first-time downloads exclude re-installs, and you can use this KPI to measure the conversion rate from your paid and referral traffic. Because users can download an app without viewing your product page, this ratio can be even higher than 100%.
- Conversion (install) rate = First-time downloads / unique impressions. This is a common KPI for the App Store, and it considers the downloads from news users that have seen your app anywhere in the store. Use this ratio to determine how well your app converts the impression to downloads.
- Search conversion rate = First-time downloads / unique impressions filtered by the Search as a source type. With this KPI, you are focusing only on the App Store Search and are eliminating the effects of paid UA or promotional effects.
There are other KPIs you can use, but for the most part, you want to start with the focus on the user conversions.
The main interface in App Store Connect
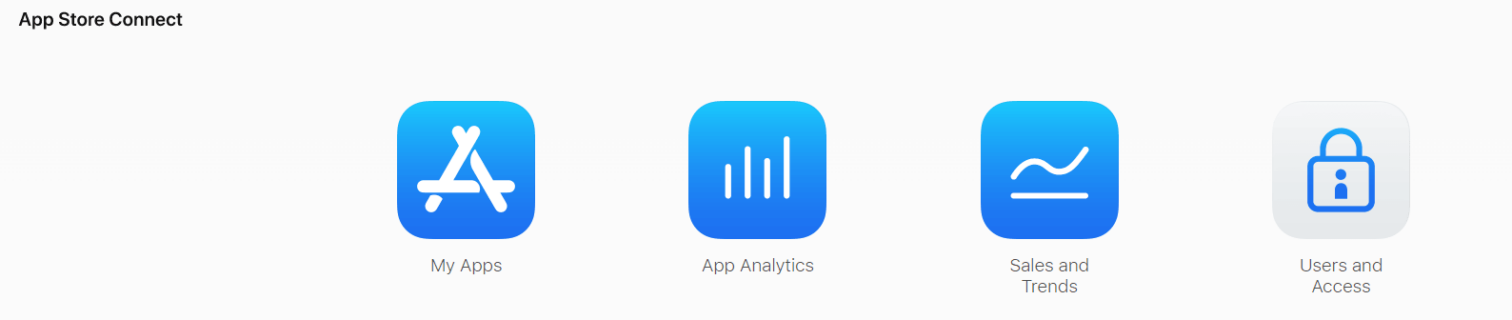
Once you login to the App Store Connect with your Apple ID and password, you will have the option to select one of the four main sections:
- My apps – the place where you can manage everything around your apps – submission, metadata, app assets, pricing, rating and reviews, and Apple’s features
- App Analytics – here you can access detailed information about how your app is performing in terms of impressions, install units, Apple’s payouts to you, sessions, product page views, and much more.
- Sales and Trends – provides in-depth data on revenue information with Subscriptions and Sales tabs.
- Users and Access – this assigns up to nine different roles and accesses to the Sandbox with the list of app testers.
We’ll go through each option and explain how to use them for actionable insights. Throughout the article, we’ll use one of our test app games, Ballscapes, to show you the graphical interface and platform menus.
How to optimize and manage your app in App Store Connect
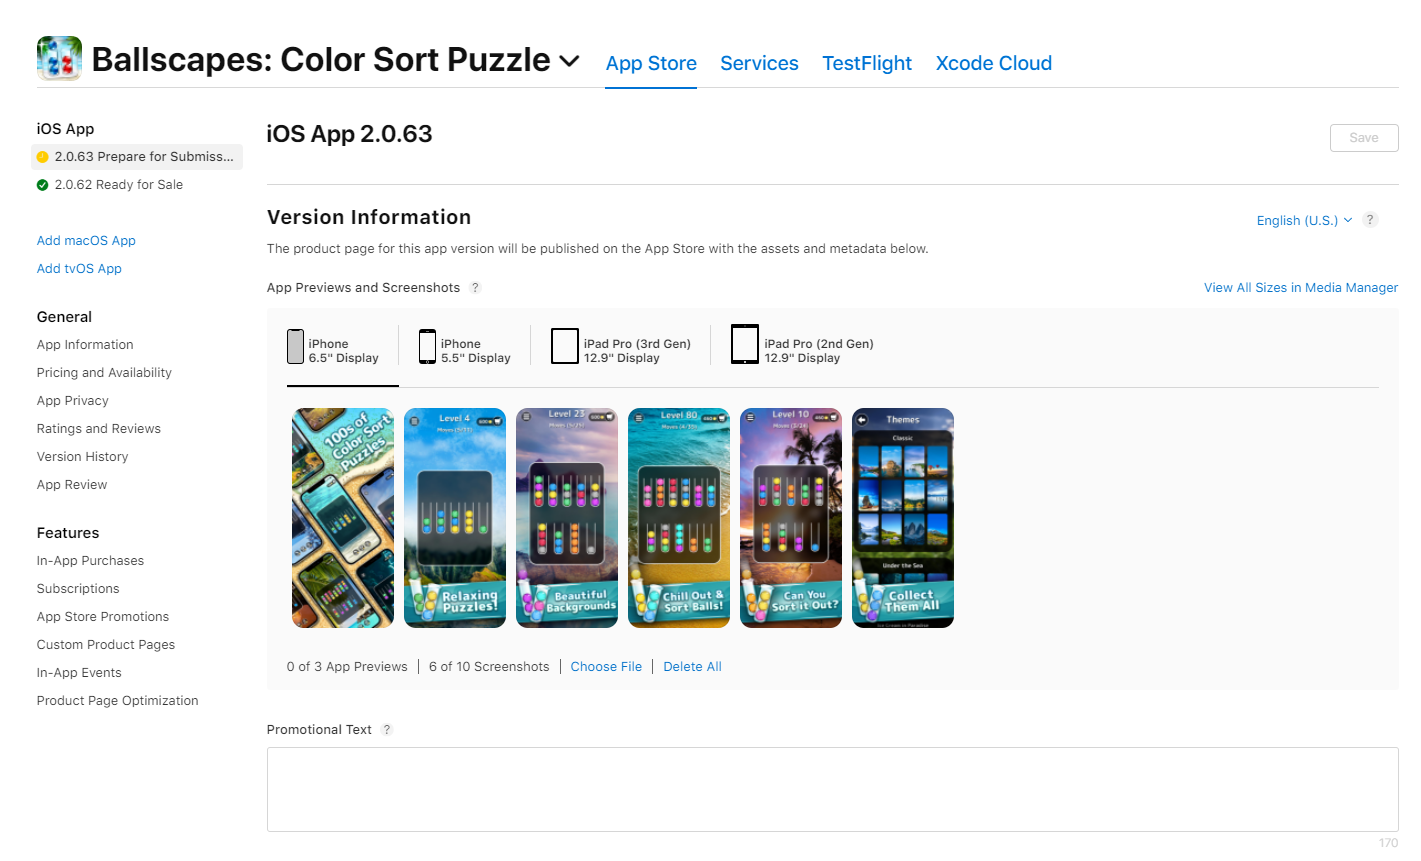
When you enter the My Apps section and choose your app, you will have four additional tabs in the heading part – App Store, Services, TestFlight, and Xcode Cloud.
App Store section
Inside the App Store tab, you will see the left side menu with everything related to app store optimization and promotion.

Version information
The first screen you will see by default is the current version of your app and the following version you plan to release in the “prepare” status. Using the app version tab, you can upload the one part of your metadata:
- App screenshots and app video previews for iPhones and iPads
- Promotional text – current app features that don’t require an updated app submission
- App description with details of app’s features and functionality
- What is new in this version – here, you describe new features, bug fixes, and improvements
- Keywords field – up to 100 characters you should use to put keywords that describe your app
- Website URLs that support your app or are used for marketing purposes
- Additional functionalities for iOS users – App Clips, iMessage app, and Apple Watch icon and screenshots
- Technical aspects of the app – build uploads, app review information, version release, and phased release
It is important to highlight two things here:
- To localize your app, you will have to provide metadata information for each of your localizations inside this tab. The most common primary language is English, and if you choose not to include the localization, the local audiences will see your default app language or primary language. If you manage multiple languages in the App Store, we suggest you read our guide to iOS localization.
- Once you hit the release button for the new app version, it can take from two days to one week for Apple’s reviews to approve the new version and the metadata and images that come with it.
General subsection
The General part consists of a couple of tabs important for app marketers. Your job as an app marketer is to use these tabs and ensure that you don’t miss any critical information when publishing your app.
App information
This part includes app name and subscription, which are ranking factors in the App Store. Like Google Play, you need to add this for each localization you run. You also need to provide general information such as your primary language, category and subcategories, age rating, and license agreement.
Pricing and availability
In this tab, you can provide the price of your app, the tax category, geographical availability, and how the app is distributed.
App Privacy
This section includes information that Apple needs to know about your app with the launch of iOS 14, such as privacy-related changes, types of data an app is collecting, and whether the app is tracking users. You can disclose most of the data optionally.
Ratings and reviews
Here you can see the overall number of ratings and reviews people leave on your product page for each location. If you have the developer role, you can reply to reviews.
Expert tip: unlike in the Google Play Console, you can reset the app’s ratings in App Store with every new version release. The reset might come in handy if you are launching a new app version, but it also comes with a risk. The algorithm might see this as a bad sign, and the users won’t see any quality signals anymore.

App Review
Here you can see information related to the App Store version review/approval process, including the history of your releases.
Features subsection in App Store Connect
Inside the App Store’s feature pages, you can promote your products using store-specific features. Let’s have a look at each of them.
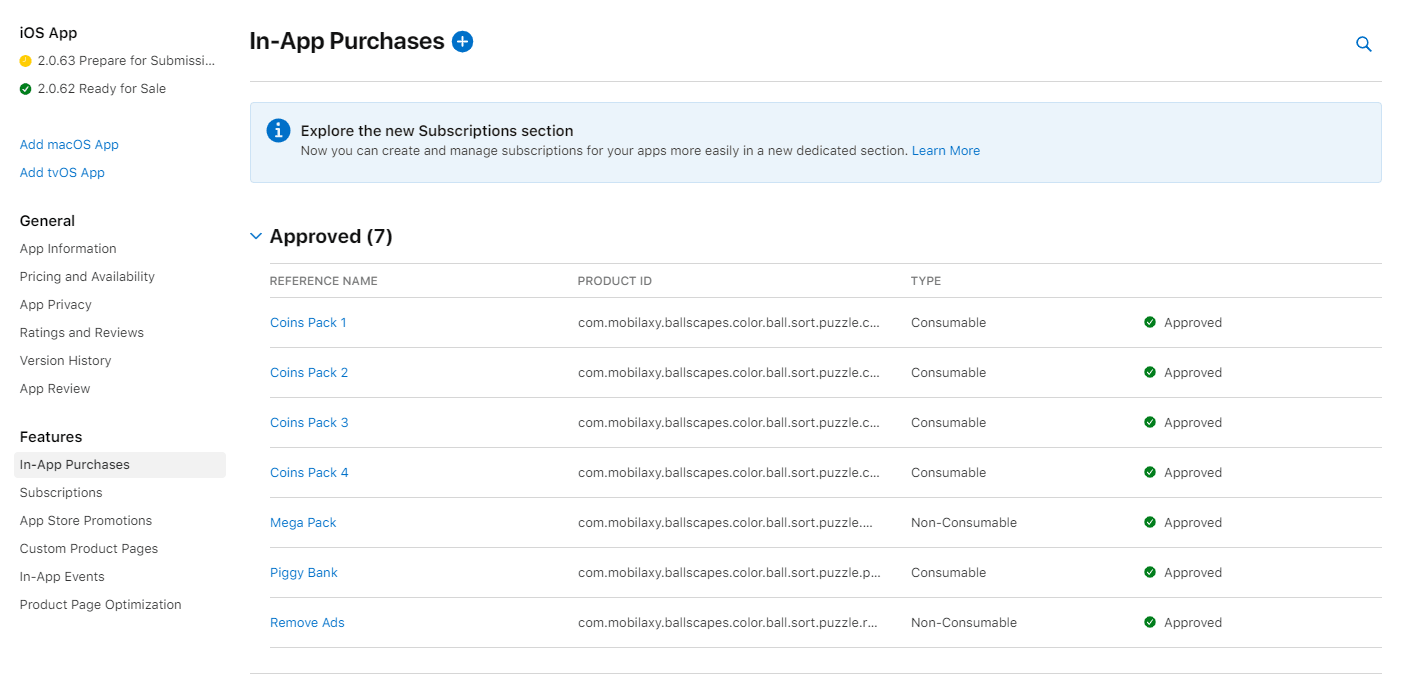
In-app purchases
App Store search results show regular search results app, but also in-app purchases or IAPs. The in-app purchases are essential not only because they stand out in the form of the typical search results but also because they are likely indexed for the keywords used in the IAP title.
The in-app purchases often appear together with the supporting app in the search results. Based on this, we know that Apple uses the keywords from IAPs to improve the app’s visibility.
Inside the App Store Connect, you can create and manage your in-app purchases for all localized versions of your app.
Subscriptions
Similar to Google Play, you can allow your users to buy dynamic content from your app for a limited period. App Store has a dedicated place where you can create and manage your subscriptions, as well as the subscription groups and auto-renewable options.
As an app publisher, you also can offer multiple subscriptions for one app. Or you can work with other app publishers and offer your app as a part of the app bundle subscriptions. If you use the subscription option, you can add additional metadata for the bundle and get more visibility.
App Store promotions
App Store promotions are used to promote the existing in-app purchases. You can promote up to 20 in-app purchases that will be shown on your app’s product page, inside the search results, or Apple’s editorial team can even feature them.
Once you add a promotional image to your existing in-app purchases, they will be available for the promotion. You can find the list of these promoted in-app purchases under this separate tab in App Store Connect.
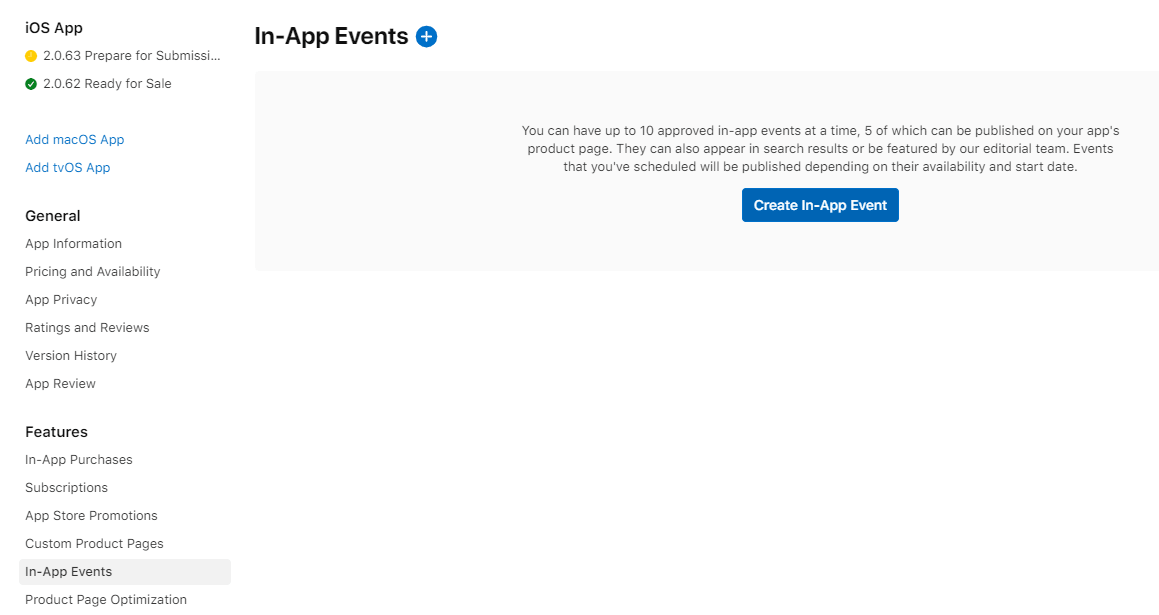
In-App Events
In-app events have been added to the App Store with the launch of iOS 15. In-app events are promotional cards with indexable event names, and short and long descriptions, giving app marketers more promotional possibilities.
App Store Connect allows app publishers to create up to 10 in-app events simultaneously, but only five can be published on the app’s product page. The in-app events can appear in the search results and be featured by Apple’s editorial team. You can use in-app events to, e.g., attract back the customers that churned.
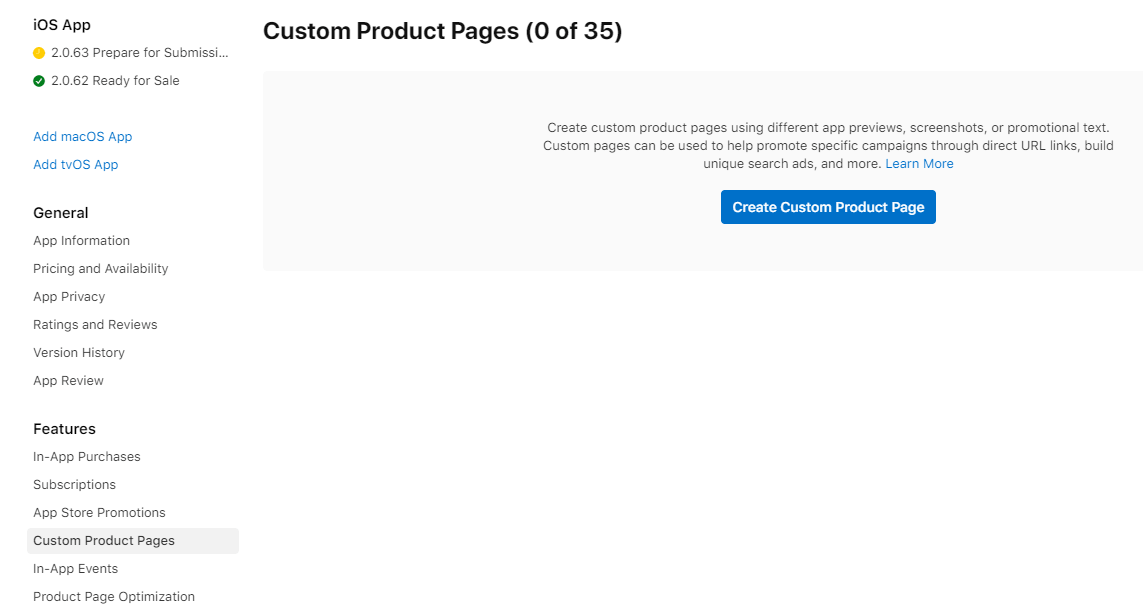
Custom Product Pages
Custom product pages were one of the most significant updates released with the iOS 15. They allow app developers and marketers to create variations of the main product page by changing the app’s screenshots, preview videos, or promotional text. You can launch up to 35 custom product pages without limitations on the number of pages per country.
Custom product pages have a dedicated URL which app marketers can use to promote through other ad types. App Store Connect provides detailed documentation on how to create these pages. Before you start creating them, group them by the proper criteria and invest resources in asset creation. The best way to use custom product pages is to customize the product page for specific target groups to reduce cost-per-installs and improve your app install rate.
Product Page Optimization
Product page optimization is a native A/B testing tool launched by Apple with the release of iOS 15. ASO experts can now combine this with Google Play Experiments to perform A/B tests directly in app stores. Furthermore, ASO teams can understand how each app store performs and the impact of different page elements on conversion rates.
ASO specialists can test all visual assets – icons, screenshots, and preview videos. Testing allows up to four variations – one current variation and three new variations. Similar to Google Play, you can split the audiences based on the number of variations you are testing, but the overall testing options are still limited compared to Google Play.
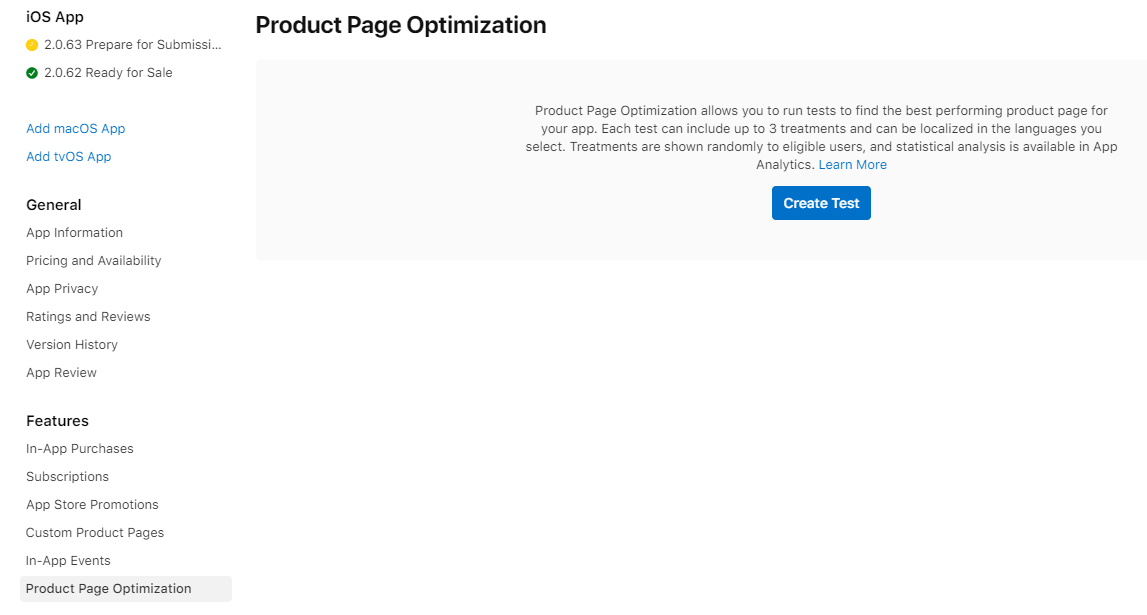
The App Store Connect analyses the Product Page Optimizations in the Analytics section.
Other App Store Connect options for apps
Before continuing with our App Store Connect guide, there are three more tabs that you might find helpful if you are an app developer.
App Store Services
There are three main tabs inside the Services section:
- Game Center – if you are in the game business, you can use the Game Center to enable challenges, leaderboards, and achievements.
- Encryption – for particular cases, if your app uses encryption, you need to specify it here.
- Promo Codes – you can use this if you want to activate your users and offer them promo codes to buy one of your in-app purchase packages.

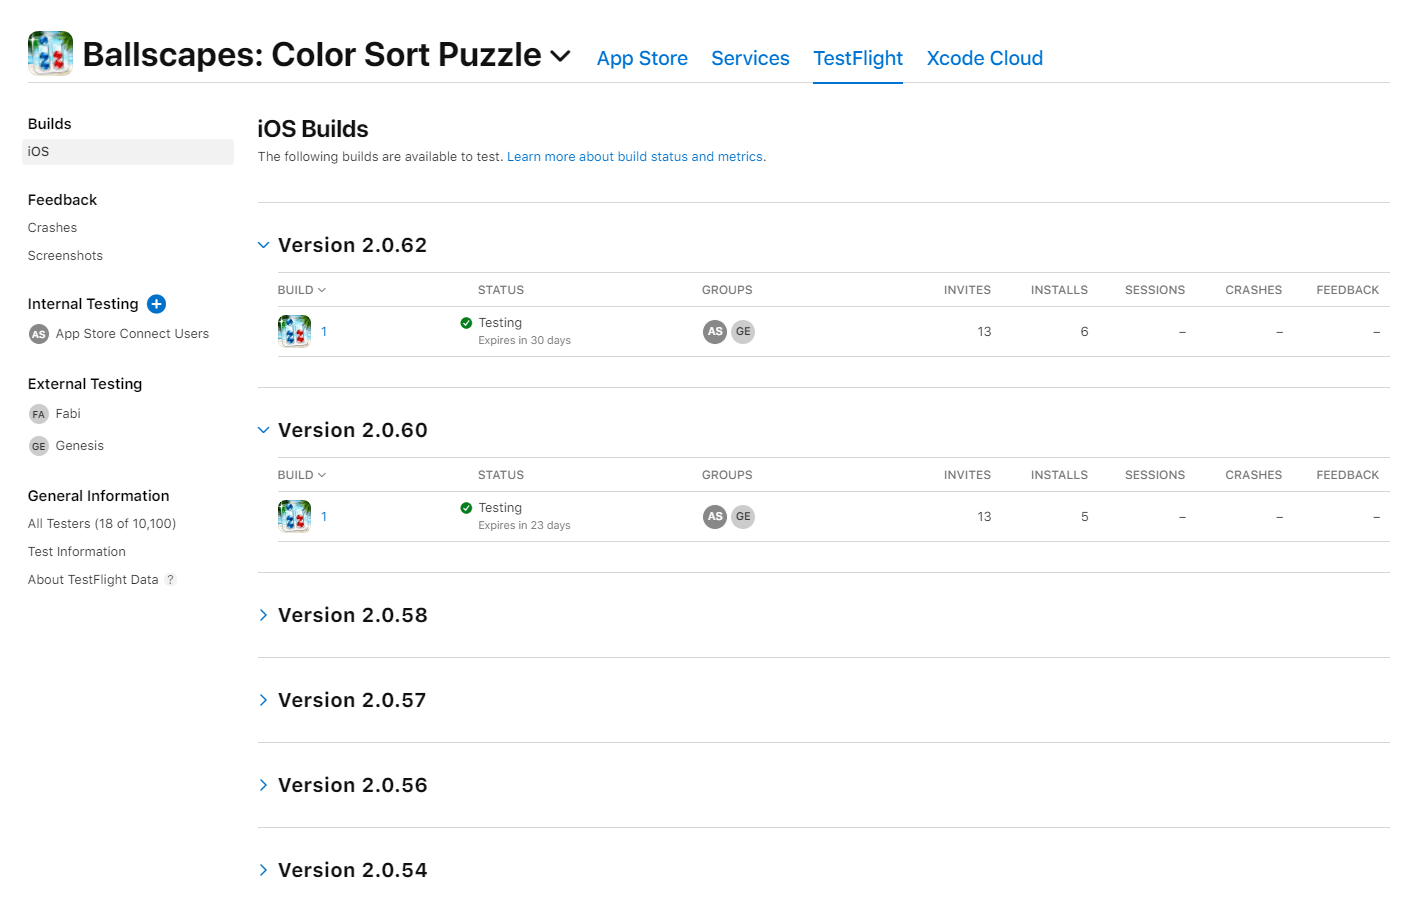
TestFlight
TestFlight is where you can manage everything around the app’s testing process and test your app before making a general market launch. The things you can do with TestFlight include typical testing elements:
- Builds for each app version with a general overview
- Feedback with crashes and screenshots
- Internal testing with App Store Connect Users
- External testing and tester that use this
- General information – list of all testers and test information
Xcode Cloud
Xcode Cloud is a section intended entirely for app developers and the delivery of apps in the cloud. It includes specific app development tools and environments such as automated testing, user feedback management, app testing, etc.
Because this guide mainly focuses on app marketing and ASO, we are skipping this section and heading towards another big part of the App Store Connect – the Analytics section.
App Store Connect Analytics
App Analytics is where you get detailed information on how your app is performing in the App Store. If you are an ASO professional or app marketer, you will spend most of your time in this section evaluating your app’s performance and guiding your ASO strategy.
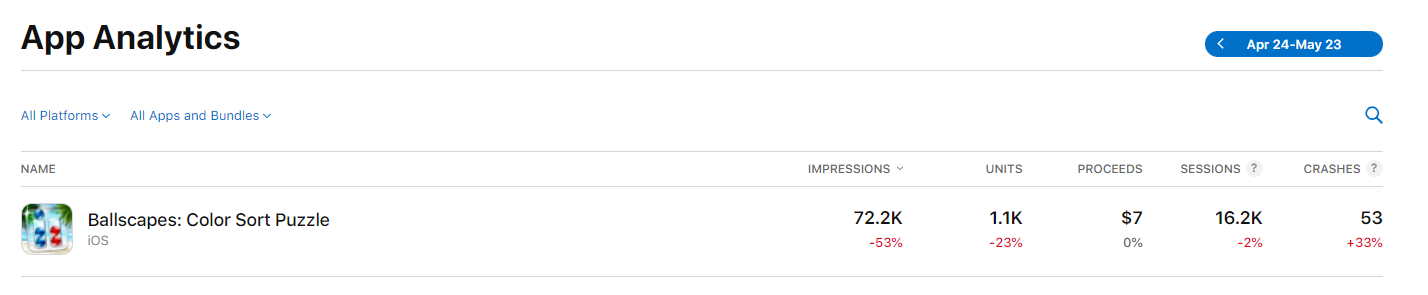
Once you navigate the tab, you will have the list of your apps and a summary of metrics inside the App Store Connect – impressions, units, proceeds, sessions, and crashes.
When you select your app of choice, App Store Connect will present you with four different tabs
- Overview tab with most essential metrics
- Acquisition tab showing sources and campaigns
- Graphics subsection where you graphically display each metric from the App Store
- The Retention tab shows how well your app retains the users 29 days after the app install
To get a good understanding of how our app is performing, we need to have a look at each separate report group.
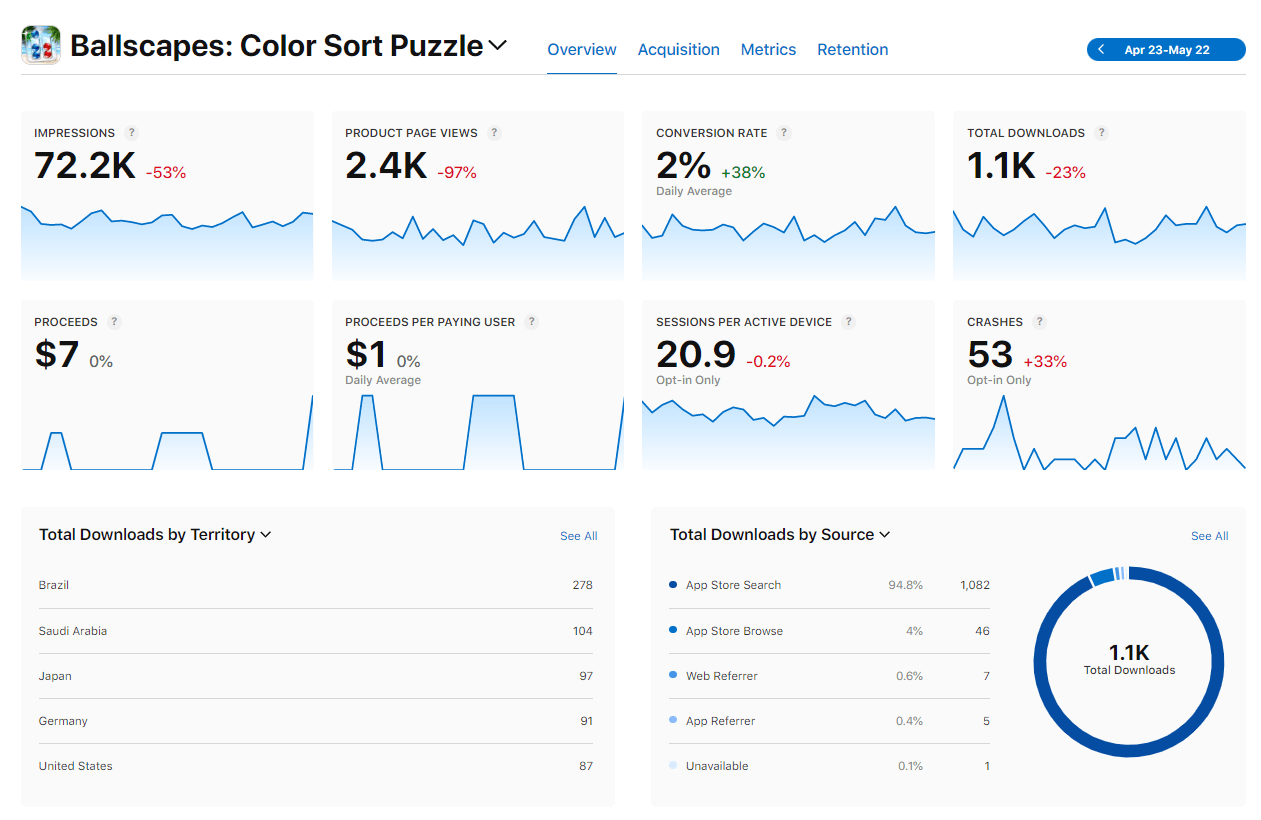
The Overview section in App Analytics
The first screen in the App Analytics tab is the “Overview” view, with different metrics broken down into small charts and simplified tab views. Similar to Google Play, this view is beneficial to get a quick picture of your app’s performance and if your app is developing in the right direction.
The metrics you can see in the Overview tab are:
- Impressions – The number of times users viewed the app’s icon on the App Store
- Product page views – The number of times store users viewed the app’s product page on the App Store
- Conversion rate – total downloads divided by unique device impressions
- Total downloads – The number of first-time downloads and redownloads on devices
- Proceeds – The estimated amount of proceeds the developer will receive from their sales, minus Apple’s commission
- Proceeds/paying users – the ratio of proceeds and the number of unique users that paid for the app or an in-app purchase.
- Sessions/active devices – the number of times people used the app for at least two seconds divided by the total number of devices with at least one session during the selected period.
- Crashes – the total number of crashes
You can also see the total number of downloads per territory by source, device, and average retention. Clicking on these charts will refer you either to the “Metrics” tab or the “Retention” tab for more detailed information.
Before digging deeper, you should note that some metrics don’t give you precise numbers. The usage metrics in the App Store connect come only from the users that have opted-in to share them with you. Most often, around 30% of all users will opt to share the data with you, meaning most of the data will not be in the reports. We’ll come back to that a bit later.
The Acquisition sub-view
The next tab you want to check is the “Acquisition” view. Inside this view, you can find data from each acquisition source and campaign tracker links if you have set them up.

The acquisition sources include the following data:
- App Store Search – users that viewed your app or downloaded it for the first time after searching App Store (includes Apple Search Ads and ASO data)
- App Store Browse – users that viewed your app or tapped to download it for the first time while browsing the App Store (e.g. in the featured, categories, top chart, or related apps sections)
- App Referrer – users that tapped a link in the app that brought them to your App Store product page
- Web Referrer – users that tapped a link on the website that brought them to your App Store product page
- All other sources
- Institutional purchase
- Unavailable
For the ASO teams, this report gives you valuable insights into the main channels that drive your app’s performance. Also convenient is the right side of the report, where you can choose additional filters – App Store data, downloads, sales, and usage data for the requested period.
The “Metrics” sub-view
Inside the “Metrics” sub-view, you can drill down and filter data by all dimensions available in App Store Connect. The data you view can also be exported and compared in dual-axis and calculated ratios.
Furthermore, you can see the Apple software updates annotations. We find it is helpful to use the save view option so the next time you come to the report, you can skip directly to the reports you create.
The “Metrics” sub-view can help you spot the trends and perform more advanced analysis. Some of the things we suggest to have a look at are:
- Comparison of conversion rates by country
- Improvements in App Store search impressions after a metadata update
- How visibility optimizations influence the download data and revenue per user
- Understanding how key ASO factors (impression and app units) are performing in the long term

The metrics you can use include:
- App Store metrics – impressions, impressions for unique devices, conversion rate, product page views, product page views for unique devices, and updates
- Downloads – first-time downloads, redownloads, and total downloads
- Sales – in-app purchases, proceeds, sales, and paying users
- Usage – installations, sessions, active devices, active users for the last 30 days, crashes, and deletions
As mentioned before, the metrics group under the Usage category are opt-in only, so they come only from the users that agreed to share them with you. App Store Connect will share with you which percentage of users decided to opt in, which should help you understand how much data you have in your reports. Every time you click on the opt-in-only text, you can choose the opt-in rate history, and you will be presented with the “Rolling 90 Day Opt-In Rate History” for your metric.
All the metrics mentioned above can be broken down by two additionally filters that include:
- Date
- App version
- Device
- Platform version
- Page tye
- In-app event
- Region
- Territory
- Source type
- App referrer
- Web referrer
- Campaign
- Purchases
There are plenty of things and reports you can create with this data, so make sure you don’t get lost and focus on the things that matter to you.
For example, you can check how significant is the impact of App Store Search vs App Store Browse in terms of app performance. Or, you can find top referrer apps and work on their relationship. But for ASO teams, the most significant implication is to check how the improvement or loss in keyword rankings influences the App Store Search segment and total app downloads.
Finally, we should note that similar to Google Play, navigating through App Store Connect reports can be very time-consuming. And if you are doing app store optimizations, you will find it is tough to optimize for the App Store using App Store Connect only. There are many different reports; each localization has its tabs and analytics pages located in other sections.
That is why we developed our ASO tool that integrates with App Store Connect and gives you access to keywords rankings, competitor research, store listing updates, and much more in one place.
If you are still not using App Radar, sign-up and test the platform for free for 7 days. You will quickly notice how much more effective your work is and how you can grow your app downloads and KPIs with App Radar.
The “Retention” subview
The last tab in the App Analytics section is the “Retention” report. Using this report, you can find some valuable insights like
- How good you are retaining your app users
- How successful your engagement campaigns are for retention numbers
- How retention data is changing based on your ASO and other marketing efforts
Inside the Retention report, you can check the retention numbers for
- users that acquired your app 30 days ago
- day one retention and the percentage of users that used the app on the 1st day after the first installation
Daily retention for each of the last 29 days (opt-in data only).
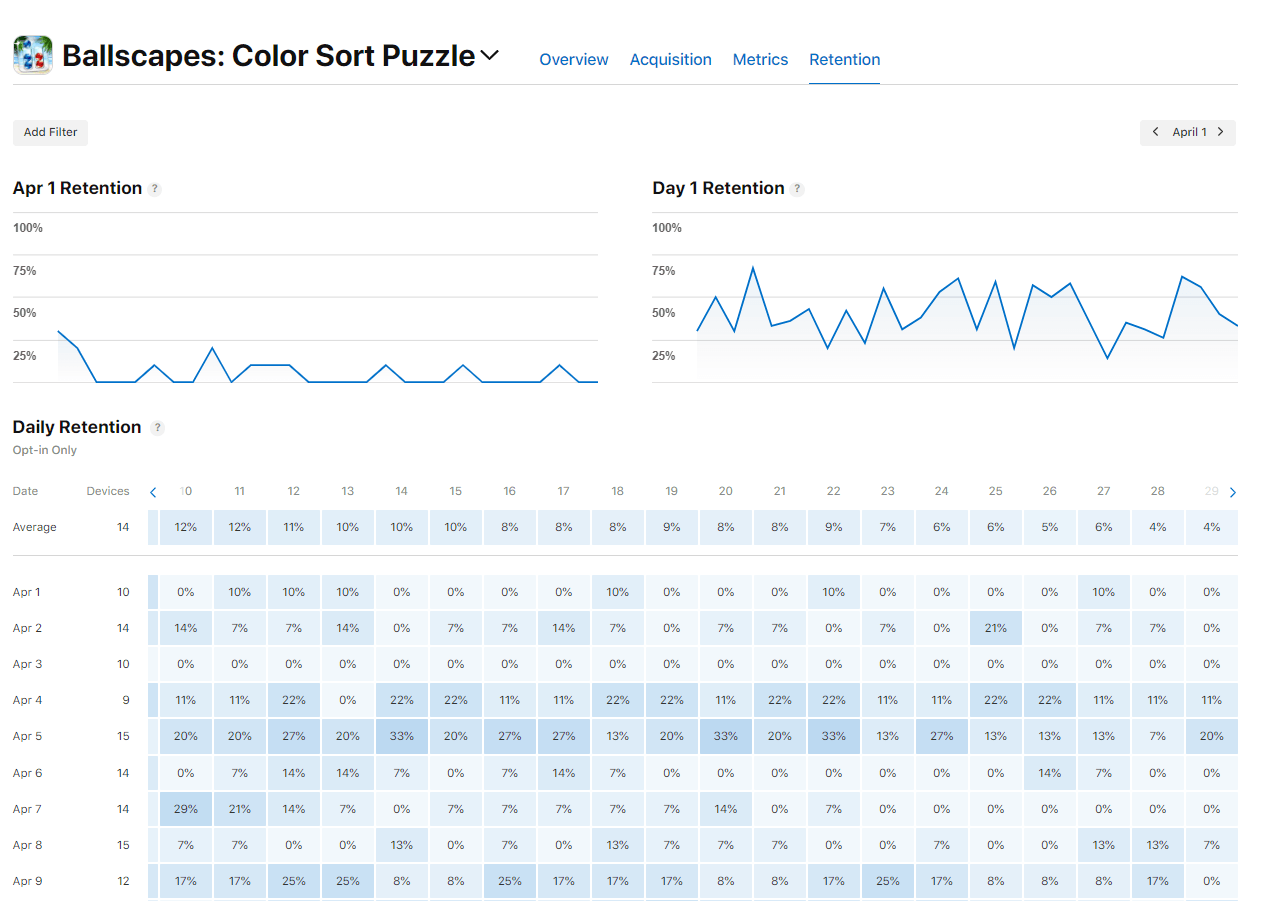
Finally, you can use the retention metrics in combination with filters that you can use in the Metrics subview as well. This will show you which of your users are the most valuable and which channels, devices, or behavior types contribute the most to your retention metrics.
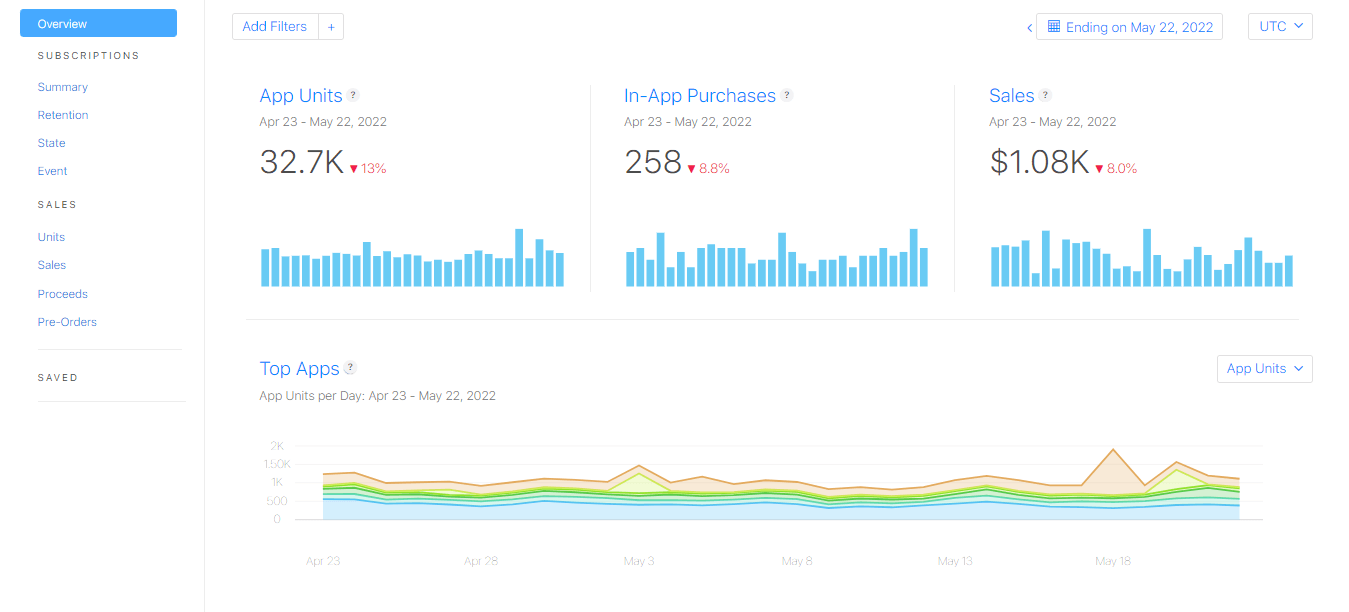
Sales and Trends data in the App Store Connect
The Sales and Trends section is where you go when you want to see how the financial side of your business is doing. It is also advantageous to check the trends for all the apps you manage and how they perform. Until now, we looked at the section based on the data for a single app. However, Sales and Trends give you reports and data on all your products.
There are three primary tabs inside the Sales and Trends section.
- Overview tab with total app units, in-app purchases, and sales numbers across all your apps. You can also see your top-performing apps, territories where your apps are installed, and devices they are installed on
- Subscription view with summary, retention numbers, state of the subscriptions, and subscription events
- Sales view units sold, sales revenue, proceeds, and pre-orders
Subscription view
The Subscription view is where you set up and manage your subscriptions for the App Store apps. When you navigate the Summary tab, you will see a dedicated dashboard for your subscriptions and the main categories.
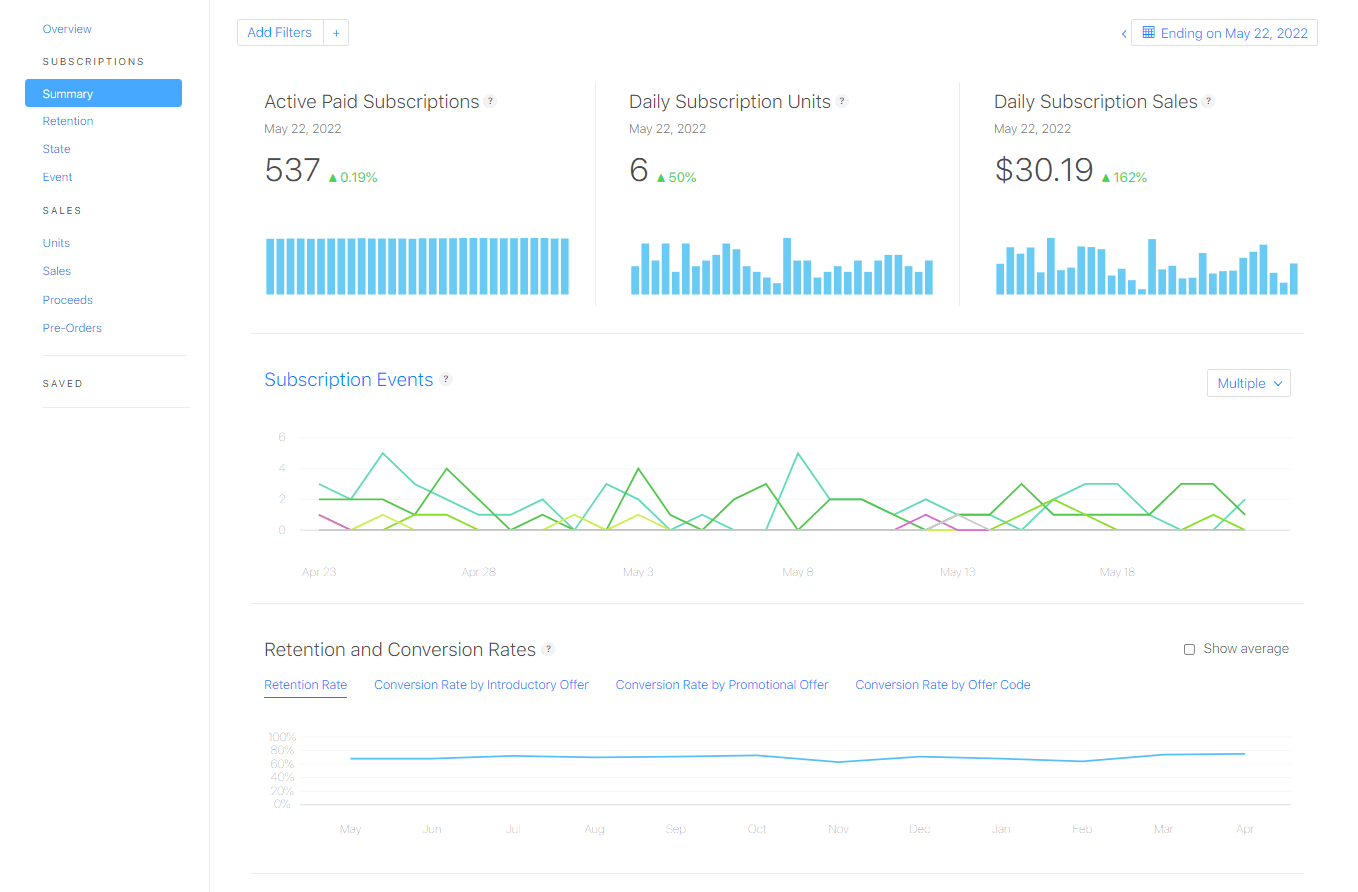
The Summary tab will show you a quick and straightforward view of your subscription categories:
- Total number of active paid subscriptions
- Daily subscription units or total purchases
- Daily subscription sales billed to customers in USD
- Subscription events like renewals and cancellations
- Retention and conversion rates
- Subscription overview by the state
- Subscription KPIs and cancellation reasons
- Active and top subscriptions
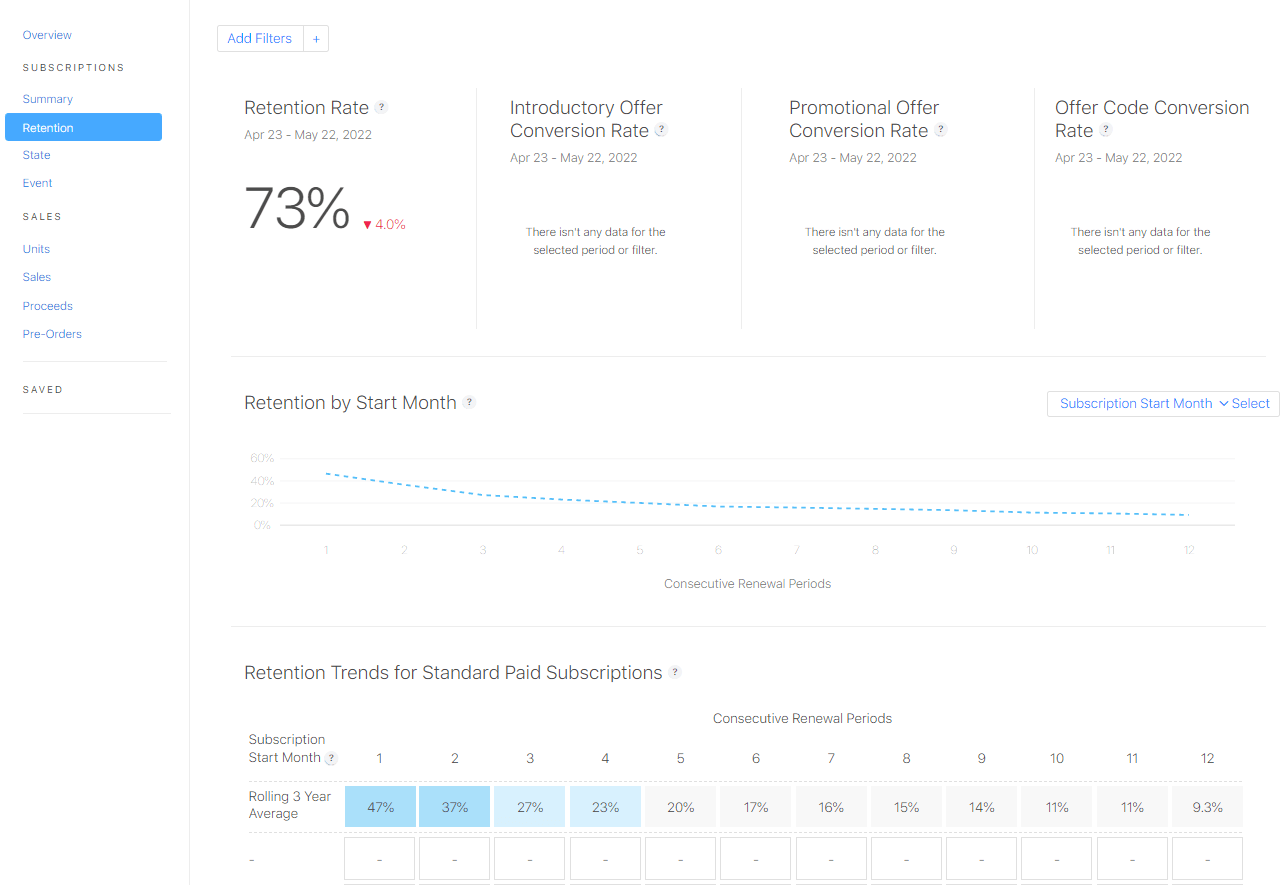
Retention data
The Retention tab shows you the aggregate data for retention rate, retention by start month, and retention trends. Additional data will be available, such as conversion rates for the introductory and promotional offer and offer code if these apply to your apps.
You can choose additional filters to see the retention data on the app level, territory, subscription duration, and subscription type.
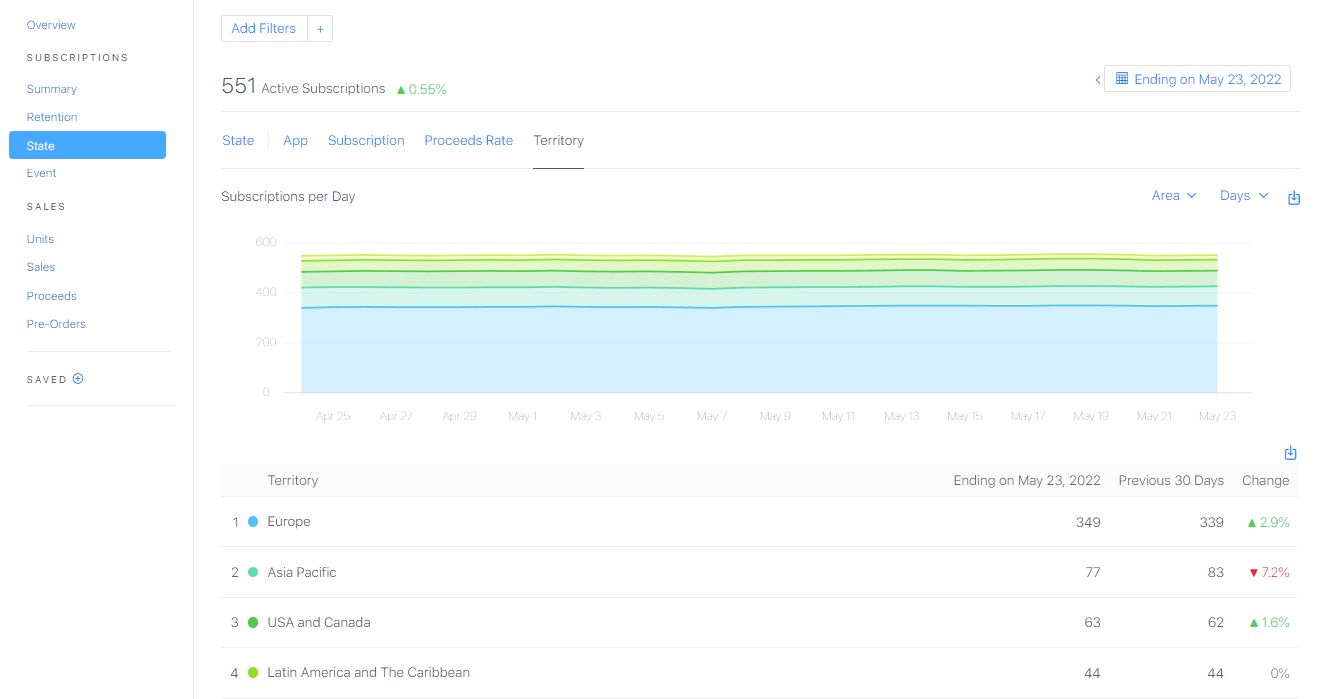
Subscription state
This tab shows the state of your current subscriptions. You can see how many active subscriptions you have, the type of subscriptions, which of your apps have which subscriptions, the proceeds rate, and the territories your subscriptions come from.
You can use different filters to drill down on subscriptions for your apps, pricing, promotional codes, and more. Finally, you can download the reports for the selected periods.
Subscription events
Inside the events tab, you can see the events that have to do with subscriptions, such as renewals, activations, cancellations, grace periods, refunds, reactivations, etc.
The additional tabs allow you to quickly filter the events by app, subscription name, duration, and territories. You can also expand the data with more filters, select the desired time frame for the reports and download them.

You can use the subscription data presented to you in App Store Connect for different purposes:
- Analyze how well your push campaigns are performing and how many new subscriptions they bring
- Compare the newly acquired users with the number of subscriptions to check their quality.
- Determine your subscription efforts’ overall success, how they contribute to your revenues, and if you need to adjust your marketing strategy.
You can generally track how your app optimization efforts contribute to your subscription goals and conversion rates.
Sales view
Sales reports show you all products you sell, such as free downloads, in-app purchases (IAP), subscriptions, and pre-orders. They offer app publishers multiple filters to get the data for the app business reporting.
The Sales view has four tabs: units, sales, proceeds, and pre-orders. Each tab has the same filters you can use to create the reports:
- Content – the ID of the product you sold, for instance, the IAP item
- Territory
- Device
- Category of each item
- Content-type – can include apps, bundles, IAPs for iOS, tvOS, and Mac apps
- Transaction type – free, paid, refund, etc.
- CMB or Complete My Bundle – the purchase of items in a bundle other than those already purchased
- App version
- Store currency
- Client
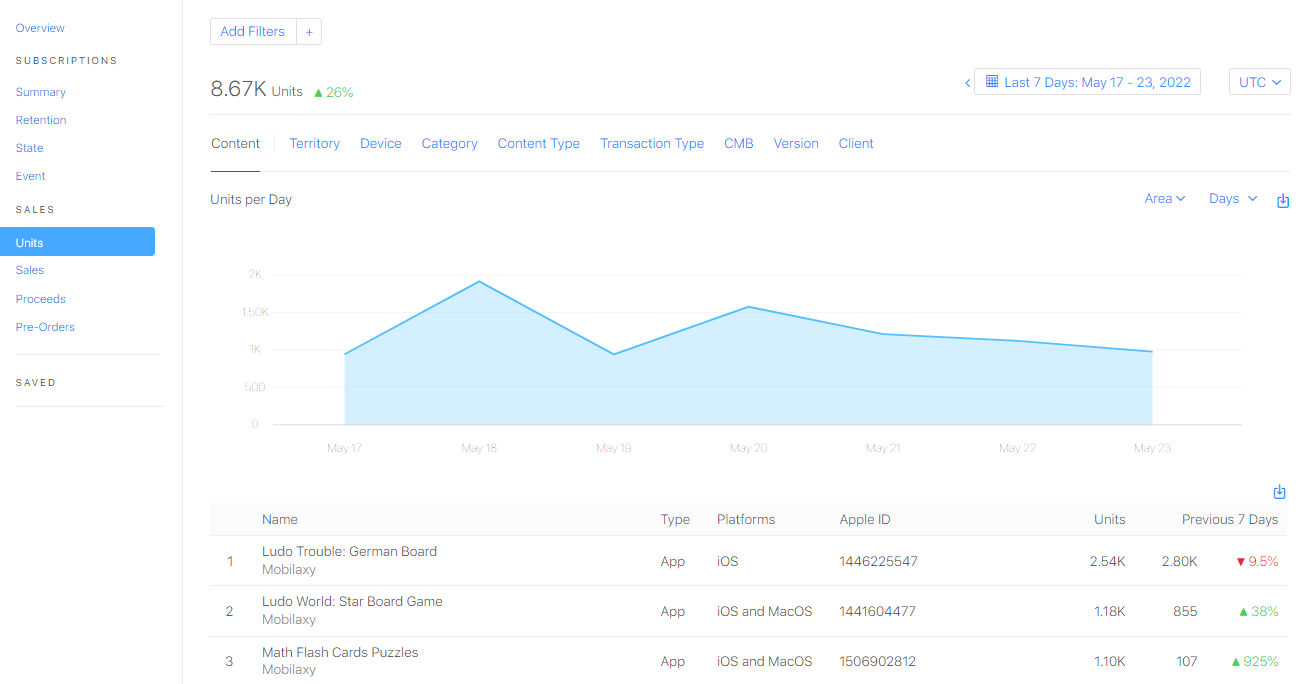
Other than that, you can choose the chart type and time frame and download your reports to move the data how you want.
Users and Access section
The final section in the main menu of App Store Connect is Users and Access. Depending on the role you have, you will see different types of reports. For example, if you are the account holder and main administrator, you will access sensitive reports, such as financial reports, payments overview, agreements, taxes, banking, etc.
App Store Connect allows you to add many different roles based on the level of responsibility. The account administrator can assign the roles and give permissions and access to additional changes.
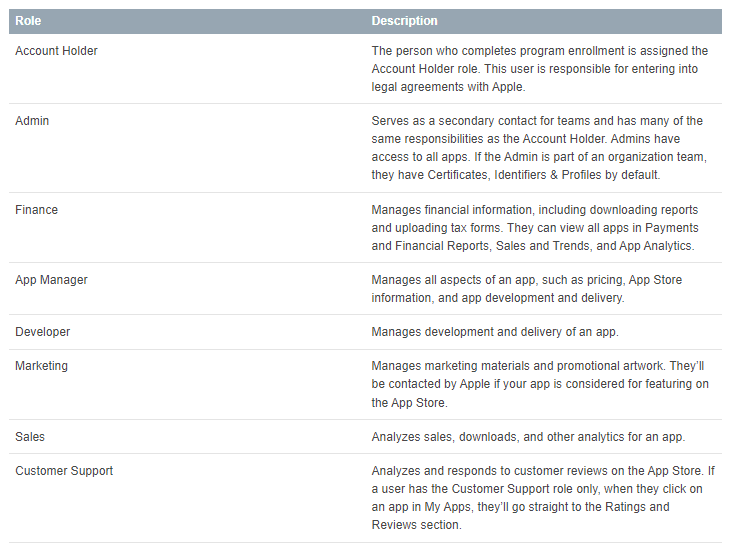
Finally, we suggest browsing the App Store Connect Help to find which reports you can access through which user roles. The Help Center will also contain additional information on all the topics and definitions you are interested in.
Best practices for using App Store Connect
App Store Connect gives app marketers plenty of data and actionable insights to work on improving apps’ visibility, conversion rates, and KPIs. You need to know how the App Store works and prepare your work environment.
Familiarize yourself with the process of publishing your metadata, uploading the visual assets, and how this works for each localization. Make sure to test and experiment with App Store features to attract users from all sources.
Finally, use the analytics to find the reports that matter the most to you and create reports you can access with a single click to save time.
Suppose you are looking to use App Store data with competitor research, keyword analysis, and paid user acquisition and want to manage your store listings more effectively. In that case, we highly recommend trying out App Radar. With all the data in one place and actionable insights, you can work on the complete optimization of your app. Give it a try for seven days and start getting better results.
Latest Posts

How to Launch an App in 2026 and Succeed: an Overview of Costs, User Acquisition and App Store Requirements
The best mobile game engines for iOS and Android in 2026
Ultimate ASO Checklist
iOS App Product Page Localization: How to Use it the Right Way to Improve ASO
Academy Lessons

Continue lessons
