Measuring App Ad Performance
Measuring how your app ads are performing is crucial to any paid user acquisition campaign. So let's talk about which metrics you need to be watching and how to analyze them. Let’s get started!

Overall Goals for App Store Advertising
The overarching goal you should have for your app store advertising strategy is to get great ROAS (return on advertising spend). Achieve this by first calculating the ARPU (average revenue per unit or user) and LTV (lifetime value) of an average user.
ARPU is the revenue a single user produces for your app business in 1 month.
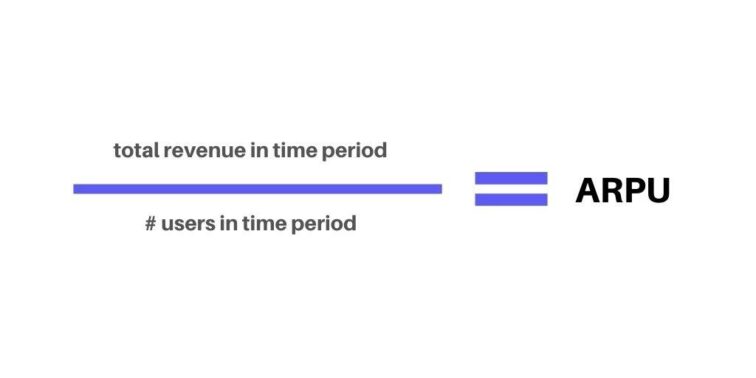
LTV is the monetary value a single user brings to your app business in their lifetime. LTV is calculated by dividing ARPU by Revenue or MRR (monthly recurring revenue) or Churn.
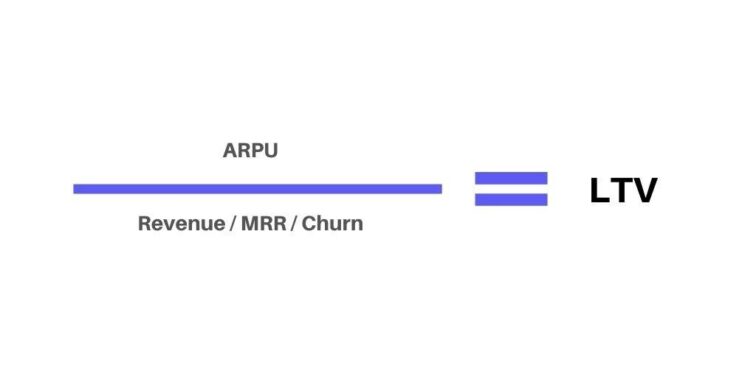
MRR (monthly recurring revenue) is used by businesses that operate on a subscription model. Since one of the major monetization models within the app industry is subscription, MRR is used frequently.
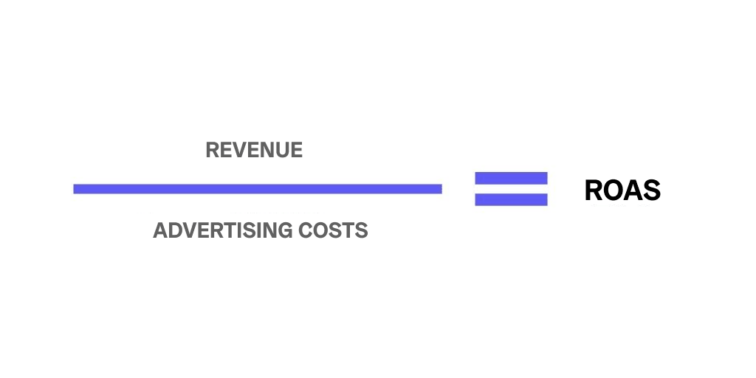
A profitable ROAS occurs when:
- Average user’s LTV is greater than their acquisition cost (CPA or cost-per-acquisition);
- Revenue is greater than advertising costs.
The ROAS value is never negative. The lowest it can be is 0. The greater the value, the more revenue your ads are bringing in. For example, a ROAS of 3 means for every $1 spent on ads, you get $3 in return.
Measuring Performance for Apple Search Ads
Apple Ads are only available for iOS apps. You’ll use your Apple ID to access your advertising dashboard. There, you’ll be able to see reports and create custom ones. Before we dive in, let’s go over the commonly used terms for Apple Search Ads.
Common Terms for Apple Search Ads
- Average CPA: Average cost-per-acquisition (CPA) is total spend divided by the number of installs (downloads) received within a period.
- Average CPT: Average cost-per-tap (CPT) is the average amount you’ve paid for a tap on your ad.
- CR: The conversion rate (CR) is the total number of installs received within a period divided by the total number of taps within the same period.
- Dimensions: A dimension is an element of your Apple Search Ads campaign that can be included in a custom report. For example, campaign ID or CPT bid. Dimensions appear as rows in your custom reports.
- Impression Share: The share of impressions your ad(s) received from the total impressions served on the same search terms or keywords in the same countries and regions. Impression share is displayed as a percentage range, such as 0‑10%, 11‑20%, and so on. This metric is only available in predefined Impression Share reports and on the Recommendations page.
- Impressions: The number of times your ad appeared in App Store search results within the reporting time period.
- Installs: The total number of conversions from new downloads and redownloads resulting from an ad within the reporting period. Apple Search Ads installs are attributed within a 30‑day tap-through window. Note that total installs may not match totals of LAT Off and LAT On installs, as additional downloads may come from customers using iOS 14 or later.
- LAT Off Installs: Downloads from users who are using iOS 13 or earlier and have not enabled Limit Ad Tracking (LAT) on their device.
- LAT On Installs: Downloads from users who are using iOS 13 or earlier and have enabled Limit Ad Tracking (LAT) on their device.
- Match Source: This identifies whether your impression was the result of Search Match or a bidded keyword.
- New Downloads: These represent app downloads from new users who have never before downloaded your app.
- Rank: How your app ranks in terms of impression share compared to other apps in the same countries and regions. Rank is displayed as numbers from 1 to 5 or 5+, with 1 being the highest rank. This metric is only available in predefined Impression Share reports and on the Recommendations page.
- Redownloads: Redownloads occurs when a user downloads your app, deletes it, and downloads the same app again following a tap on an ad on the App Store or downloads the same app on an additional device.
- Search Popularity: The popularity of a keyword, based on App Store searches. Search popularity is displayed as numbers from 1 to 5, with 5 being the most popular.
- Search Term: Search terms are keywords and phrases that people have used to find the particular type of app they’re looking for.
- Spend: The sum of the cost of each customer tap on your ad over the period of time set for your reporting.
- Taps: The number of times your ad was tapped by users within the reporting time period.
- TTR: The tap-through rate (TTR) is the number of times your ad was tapped by customers divided by the total impressions your ad received.
Important Metrics for Apple Search Ads
There are several metrics that you should focus on when analyzing your Apple Search Ads performance. Here are some of the most important ones.
Average CPA
Keep an eye on your average CPA. It plays a large role in guiding any adjustments. This value heavily depends on your app’s niche and on whether it’s a paid app or not. Paid apps are able to have more leeway when it comes to spending on CPA. More competitive categories such as gaming or fitness will also be more expensive. Need further advice? Consult our expert app marketers! They’ll help you figure out the right spending goals.

Conversion Rate
The CR or conversion rate tells you how effective your ad is. A successful ad will have a higher CR paired with a high TTR. This means people were interested enough to tap on your ad and then convinced by your app store listing to download your app. A low CR paired with a high TTR means your ad was enticing, but your app store listing needs to be further optimized. A low CR paired with a low TTR signals that improvement is needed for both your ad and store listing.
Impressions Share and Impressions
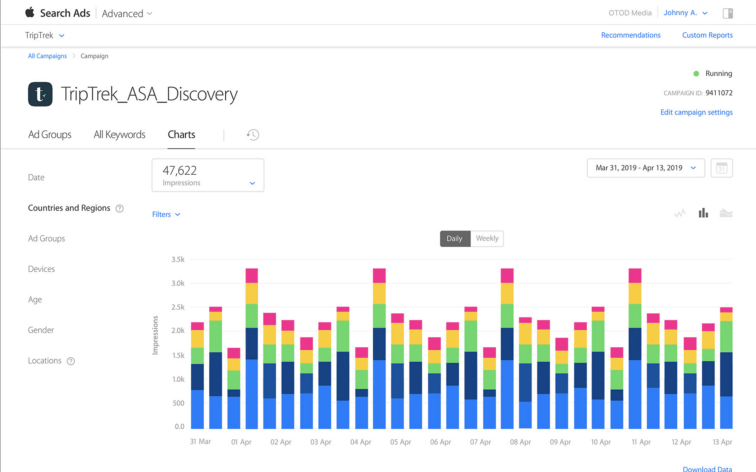
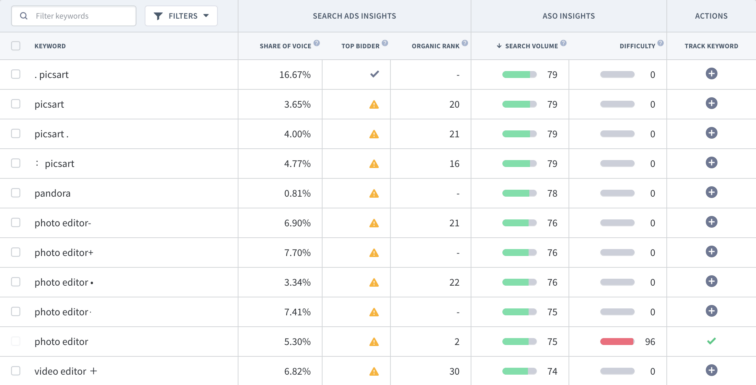
The amount of impressions you get and your share of impression, also known as Share of Voice (SOV), allow you to determine 2 things:
- If you are winning or losing in the bid auctions;
- If people are actually searching for the keywords you’re bidding on (popularity.)
Low overall impressions mean either your keywords are unpopular, or you need to increase your bid. A low impression share means your competitors are outbidding you, and you need to increase your bid.
With App Radar’s Apple Search Ads Intelligence, you’ll be able to see your Share of Voice and if you’re the top bidder for all keywords. Try it free today!
Creating Custom Reports for Apple Search Ads
Although you’ll receive general performance metrics directly in your Apple Search Ads dashboard, it’s never a bad idea to customize the reports. By creating your own reports, you’ll be able to focus on the metrics that matter most to you and identify areas in need of optimization.
To get you started, Apple provides you with some predefined reports built for standard dimensions. These are:
- Keywords Report: For all keyword performance across all ad groups and campaigns in a single campaign group.
- Search Terms Report: For all search terms and corresponding keyword performance in all ad groups and campaigns in a single campaign group.
- Creative Sets Report: For Creative Sets results by ad group, campaign, country or region, and app within a single campaign group.
- Ad Groups Report: For ad group-level data by ad group, campaign, country or region, and app within a single campaign group.
- Spend Report by Country or Region: For spend by billing entity and country or region. Useful for billing reconciliation.
- Daily Impression Share Report: For daily impression share, rank, and search popularity performance by app and country or region.
- Weekly Impression Share Report: For weekly (Sun – Sat) impression share, rank, and search popularity performance by app and country or region.
You can tweak these predefined reports or create your own.
Measuring Performance for Google App Campaign
Google runs your app ads across a variety of channels. Therefore attributing where your downloads are coming from when running a Google App Campaign ad is much more challenging than with Apple Search Ads. Attribution partners (see below) help you solve this problem.
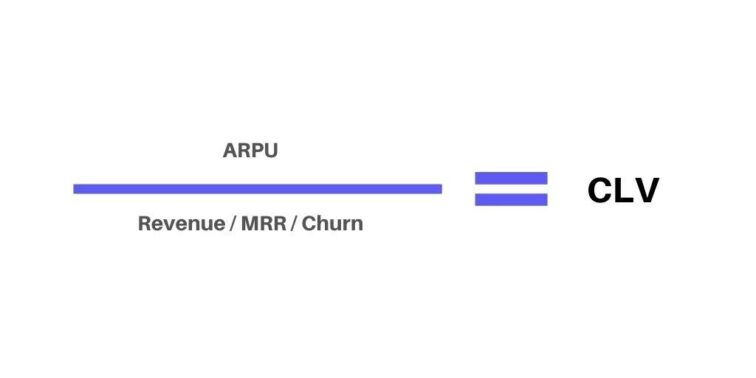
For Google App Campaign, focus on values such as CLV (customer lifetime value), which is the same as LTV, and CPA. Since Google optimizes your campaigns for you, you have to do a lot less manual monitoring and adjustment compared to Apple Search Ads.
In addition, adjusting campaign elements too quickly or drastically can end up harming your advertising strategy. Google needs time to test and optimize your ads. Constant changes don’t allow for this to happen, and changes that are too large reset the entire optimization process.
Achieving an optimum ROAS with Google App Campaign requires patience. But, apply best practices, and you’ll begin seeing results in no time.
Mobile Measurement Partners (MMP)
The best way to measure performance is to work with a mobile measurement partner (MMP), like Adjust or Appsflyer. By setting up third-party app analytics, you’ll have more control and also more transparency with campaign reporting and analysis.
Having a MMP or attribution partner is important for Google App Campaigns as well as for Apple Search Ads. These platforms help you directly correlate partners, campaigns, and ad spends with desired actions. However, it is essential to review the store policies on tracking data as well.
Summary of Measuring App Ad Performance
As with anything else, measuring app ad performance takes time and practice. However, investing in app store advertising will be worth it in the end. There are so many apps available, and your app needs to stand out in a big way. App ads put you right in front of your target audience, boosting both visibility and growth. Don’t have the time to run app ads? We got you covered! Learn more about what our app marketing experts can do for you.
Latest Posts
