What are Top Charts and How can They Impact App Traffic?
The rankings in top charts are highly dynamic, with frequent changes due to new app releases and updates.
The charts are organized by various dimensions such as category, country, and monetization model (free, paid, grossing).
Why ASO experts need to check top charts?
ASO experts should always track top charts to check how app stores rank top performing apps. Top charts also serve as a discovery mechanism for users to find new and popular apps.
Being listed in the top charts can increase an app’s visibility and attract Explore traffic in Google Play, and Browse traffic in Apple’s App Store.
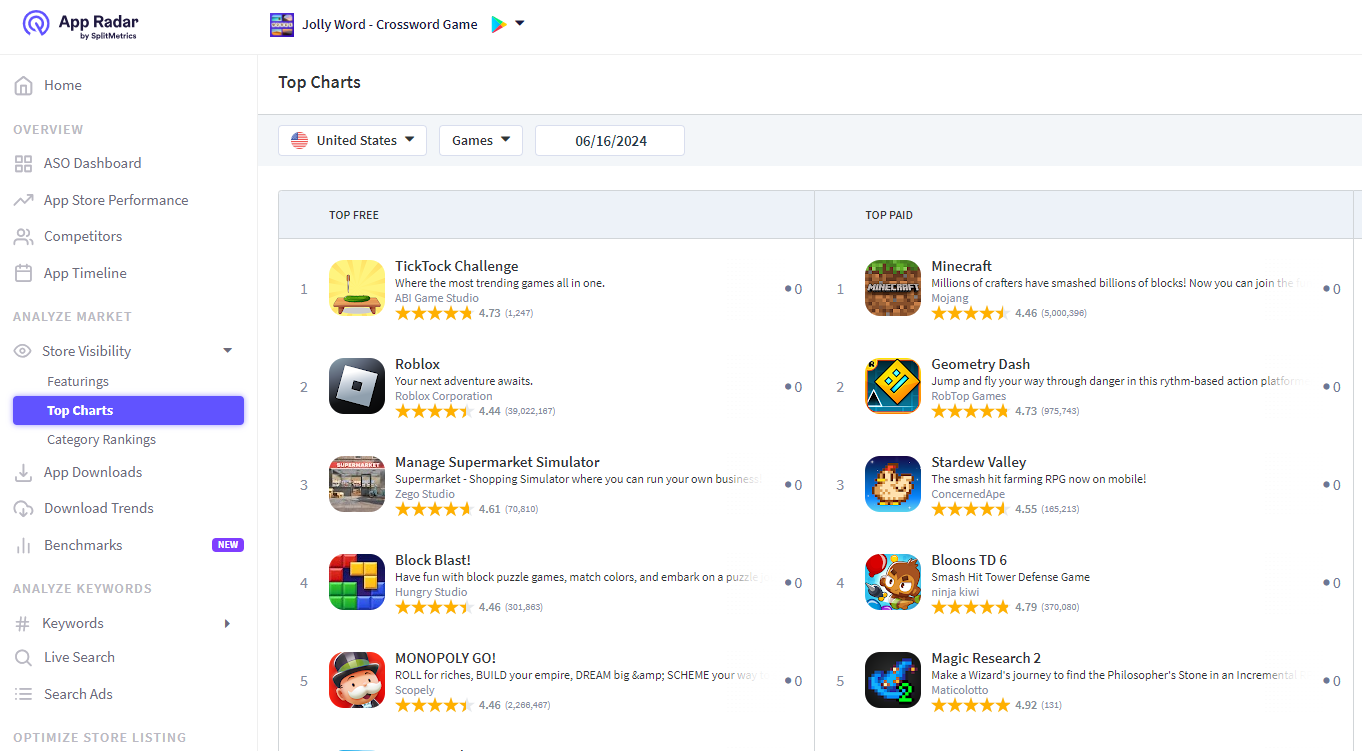
You can track top charts directly in App Radar
Here are other significant benefits for apps that are listed on the top charts.
Increased credibility and social proof
Ranking high in top charts enhances an app’s credibility and serves as social proof. For app marketers that are interested in app store optimization, top charts show which apps are currently popular in certain categories and which things those app communicate in their store listings.
App downloads boost
Apps featured in top charts often experience a surge in downloads due to increased visibility and user trust. Higher download numbers from top charts can improve an app’s ranking and visibility.
ASO strategy improvement
Analyzing top chart rankings helps app marketers understand the competitive landscape and identify trends. This information can be used to refine ASO strategies, such as keyword optimization and conversion rate optimization, to improve an app’s overall performance.
Differences Between Apple App Store and Google Play Store Top Charts
Apple’s App Store top charts are known for their volatility. Less than 25% of apps in the top 100 maintain their ranking for an entire year.
Google Play’s top charts are also volatile, with frequent changes in rankings due to new app releases and updates.
Apple App Store Top Charts
On the Apple App Store, top charts are hidden. Users need to scroll to the bottom of the Apps or Games tab, select a category, and then scroll down again to find the rankings. For that reason, top charts are less prominent for casual browsing compared to featured apps.
Google Play Store Top Charts
In contrast, Google Play’s top charts are more accessible and are located in the store’s top navigation. This visibility makes them a more effective discovery mechanism for users.
How to track traffic from top charts?
To track traffic from top charts, you need to monitor the breakdown of your app’s downloads and impressions provided by the App Store and Google Play.
This traffic falls under the “Browse” category on the App Store, while on Google Play, it is categorized under “Explore.”
Tracking Traffic on the App Store
- Access App Store Connect – Log in to your App Store Connect account.
- Navigate to Analytics – Go to the “App Analytics” section.
- Select Your App – Choose the app you want to analyze.
- View Sources – Under the “Metrics” tab, select “Impressions” and filter by “Source Type” to see traffic from “Browse.”
- Analyze Data – Look for spikes in Browse impressions and downloads. While you can’t filter the data by top charts, the spikes could indicate increased traffic from top charts.
Tracking Traffic on Google Play
- Access Google Play Console – Log in to your Google Play Console account.
- Navigate to Statistics – Go to the “Statistics” section.
- Select Your App – Choose the app you want to analyze.
- View Acquisition Reports – Under “User Acquisition,” select “Explore” to see traffic from the top charts.
- Analyze Data – Look for spikes in Explore store listing visitors and downloads. Again, if you see unexplainable increase in downloads, it could be because your app is ranking high in top charts.
How to track the impact of top charts on ASO?
If an app gets featured in the top charts, app owners will likely see a spike in Browse impressions (App Store) or Explore Store listing visitors and downloads (Google Play). However, this may be accompanied by a temporary drop in Browse/Explore conversion rates.
If the additional exposure from a top charts feature is not translating into actual downloads, there are two key things to investigate:
- The app’s relevance to the featured story/collection. If it’s not well-aligned with the app’s value propositions, it’s less likely to drive downloads.
- The app’s position within the featured. The higher the app is listed, the more likely users will see and download it.
ASO tools can help measure the impact of top chart features over time and compare performance against competitors. While getting into top charts doesn’t directly drive installs, it can provide a valuable visibility boost when executed well.
Top Charts Key Takeaways
Top charts are vital for ASO as they enhance app visibility and drive organic traffic. They serve as a discovery mechanism, boost credibility, and can lead to increased downloads.
Apple App Store and Google Play Store have different approaches to top charts, with Google Play offering more accessible rankings. Tracking traffic from top charts involves using App Store Connect and Google Play Console to monitor Browse and Explore categories.
If you want to measure the impact of top charts on ASO, you should use both ASO tools and reports from app stores.
right in your inbox.
Latest Blog Posts

The best mobile game engines for iOS and Android in 2026
How Watch Duty Became the #1 Wildfire Tracking App on the App Store
How to promote your mobile game and increase Google Play and App Store downloads
Top 7 Game Mechanics for Hypercasual Games: who came out on top?
Latest Academy Lessons

Google Play Store Ranking Factors: How to Rank Your App in 2024
What Is App Store Optimization (ASO)? The Most Actionable Guide for 2026
ASO ranking factors in 2026: how the App Store and Google Play actually rank apps
ASO vs SEO: Understanding the difference between website and mobile app optimization
Featured Posts