Key Metrics to Monitor for Subscription Apps
This is a guest post by David Barnard, a developer advocate at RevenueCat.


If you’re working on a subscription app, it’s important to have a pulse on how well it’s doing and get a sense of the general trajectory. There are some standard metrics that are a good idea for every app to monitor, while other metrics will depend on the business model (B2B, B2C, SaaS, etc.). Here, we’ll focus on apps that provide a service directly to consumers, like video streaming services or fitness apps.
In these apps, customers may be free users or pay each month for functionality. They often come into the app via a free trial and then can consume content at several different price points. In the app itself, there can be upsells from less expensive to more expensive plans, as well as add-on one-time purchases.
With these customer journeys in mind, let’s look at how to define successful business outcomes. Analyzing the right metrics will keep your team informed of whether you’re experiencing tailwinds (signs of positive growth) or headwinds (signs that your app’s growth is flagging) as your app charts a course to success.
What metrics should you track?
The success factors for a B2C SaaS app fall into four categories:
- acquisition,
- growth,
- re-engagement,
- support.
Let’s take a look at the key items in each category.
Acquisition metrics for subscription apps
Acquisition is the process of finding new customers, which is often the hardest part of any business. Here are some ways to track what you’re spending on acquisition and whether it’s paying off.
Downloads
To know how your acquisition numbers are growing, you can of course look at how many downloads your app has across the different platforms (App Store, Play Store, and web). To make attribution of new users more convenient, consider working with an attribution provider to help differentiate organic downloads (users finding the app naturally) from paid downloads (users finding the app through ads or marketing).
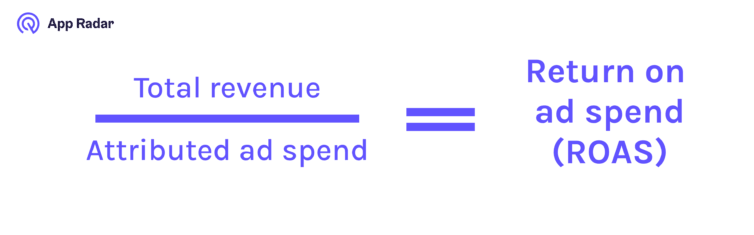
Return on ad spend (ROAS)
For paid acquisition, you’ll want to look at the return on ad spend (ROAS). This is calculated by total revenue divided by attributed ad spend. For example, if an ad campaign cost $10 per paying customer and generated $15 in revenue per paying customer within 90 days, the Day 90 ROAS would be $5 per customer. The ideal payback period and expected return depend on the specific industry, business goals, the marketing channel, and so many other factors. While a $5, Day 90 ROAS makes for an easy example, it can be very challenging to hit anything like that in the real world.
What you’re looking for is for ROAS to stay stable or increase as ad campaigns continue to perform or become more effective. Decreasing ROAS is generally a sign that you need to start testing new channels, new ads, and maybe even make changes to the app itself.
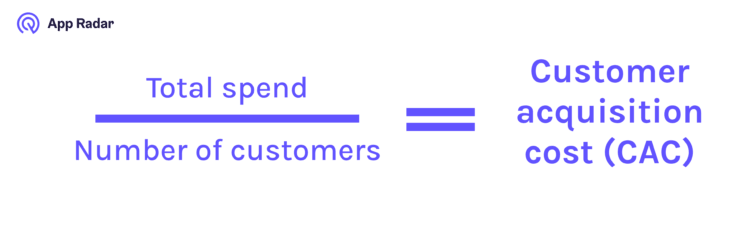
Customer acquisition cost (CAC)
Customer acquisition cost (CAC) is calculated by total spend divided by the number of customers. For example, if the same ad campaign cost $5,000 and it acquired 1000 new users, the CAC is $5,000/1000 or $5 per new user.
As mentioned above, you may also want to calculate CAC only for paying customer rather than by app downloads or other broader metrics. Many subscription apps calculate their CAC this way, but some calculate that separately and use a different acronym: CPPU (Cost Per Paying User).
Ideally, you want CAC to be less than the average amount of revenue brought in per customer. That is a quick way to determine if your acquisition campaigns are profitable or not.
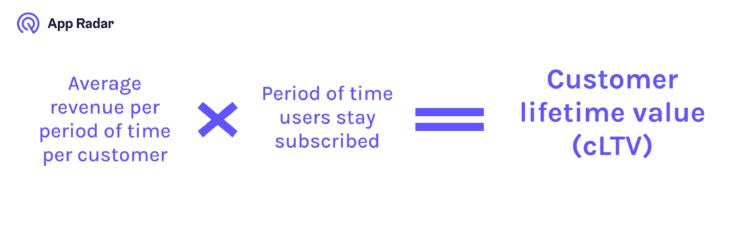
Customer lifetime value (cLTV)
Customer lifetime value (CLTV) is a measure of how much each customer is worth to the business. It’s calculated by taking the average revenue per period of time per customer (e.g. monthly subscription cost) multiplied by how long users stay subscribed. For example, if the monthly app subscription cost is $10 and users typically stay subscribed for 2 years, the cLTV is $10 x 24 months = $240.
In tracking this metric, you want to look for either your average cLTV to increase over time (each individual user becomes more valuable to your business over time) or more users start using your app, which balances out a decrease in cLTV. Note that CAC is highly related to lifetime value (LTV). If your LTV is lower than your CAC, you’re on a trajectory to spend more than you make from the average customer, which is a sign that you need to spend less on acquisition or make the subscription more valuable to customers.
Growth metrics for subscription apps
To measure the growth of your app, it is important to track the revenue that your app is bringing in, as well as how you’re doing in terms of making your users more valuable through upsells.
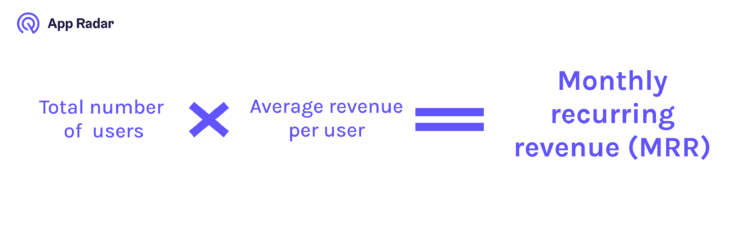
Monthly recurring revenue (MRR)
MRR is the recurring revenue from subscriptions. For example, if there are 10,000 users who subscribe for $10 each per month, the MRR is $100,000. By summing the regularly contracted revenue that a business is bringing in, MRR is commonly used to present a picture of the company’s overall health.
Annualized Customer Value (ACV)
ACV is a measure of a single account’s revenue per year. Unlike MRR, it includes any one-time purchases that the customer may have made that year. For example, if a customer signs up for a $100 yearly subscription, but also spent $30 on one-time purchases, their ACV would be $130. Tinder’s consumable purchases for Super Likes, Boosts, and other features are an example of why ACV could be much higher than what the customer paid in subscription fees.

Trial Start Rate and Trial Conversions
Many subscription apps offer a free trial to let customers “try before they buy”. The rate at which users start a trial and the conversion rate from trials to a paid subscription gives valuable insight to the effectiveness of your freemium strategy.
As with many of these metrics, there is no ideal trial start rate or trial conversion rate. Some apps are more aggressive with their freemium strategy, offering little to no content or functionality for free users. These apps tend to have much higher trial start rates, but then end up with much lower trial conversion rates. Other apps are much more lax with their freemium strategy, offering plenty of content or functionality to free users and rarely displaying the paywall. These apps tend to have lower trial start rates, but much higher trial conversion rates. Tracking these metrics will help you hone in on the right freemium strategy for your unique app.
Retention metrics for subscription apps
Retention is a measure of how engaged your paying users are, and how effectively you can attract users who stay subscribed over time. Two types of metrics can be valuable here:
Subscription Retention and Churn
Retaining subscribers is the key to building a great subscription business, so it’s an important metric to watch closely. Ideally, the rate of churn will decrease over time for any given cohort. Meaning, the longer a customer is subscribed, the more likely they’ll stay subscribed. If your month 1 churn is 25%, your month 2 churn should be quite a bit less, otherwise, you’ll quickly end up with few retained subscribers.
Cohort users by subscription start date, subscription duration (monthly, annual, etc), and other dimensions then look at both churn and retention numbers. If your subscription is shedding users, pause to figure out why before pouring more users into a “leaky bucket”.
It’s also interesting to look at how many users are paying for a subscription but not actively using the product.
User Journeys
To help understand why your overall retention numbers are changing, it’s important to map out critical user journeys — such as watching or liking a video in a streaming app — and seeing how often users in different cohorts are performing them. If users aren’t continuing with these interactions, it’s likely they will eventually churn. This type of analysis can help you identify at-risk users and target them with re-engagement campaigns.
Support metrics for subscription apps
Given a large enough product, users will always be asking questions that need to be fielded by the support team. Your metrics here should help you identify the quality of your customer experience and ensure that you prevent customers from dropping off due to a lack of support.
Successfully solved support cases
It’s a good idea to track the number of support cases opened total over a period of time and % of cases resolved successfully. One way of reducing support cases is to identify the most important topics and answer them on an easily accessible FAQ page.
It’s also important to use customer support as feedback for app development. Customer support can be a great source of ideas for new features that your customers may find valuable and other ways the app can be improved.
Net Promoter Score (NPS)
Net Promoter Score is a measure of how many users would recommend the app to others. Generally, this is calculated by surveying users on a ten-point scale about how much they enjoy the app, then subtracting the percentage of users who gave a low score (zero through six) from the percentage of users who scored highly (nine through ten). Users who rated a seven or eight are not counted. For example, if 30% of users scored a 0–6, 20% of users scored a 7–8, and 50% of users scored a 9–10, the NPS would be 50% - 30% = 20. Higher numbers indicate greater customer satisfaction and more referrals, while lower numbers indicate there is work to be done.
Summing it up
There are many different metrics to look at from a variety of sources to understand how your app is performing. Focusing on the areas of acquisition, growth, reengagement, and support — while being clear about which one can be the most impacted in the short term — is a key way to ensure your app’s continued success.
With RevenueCat, you don’t have to clean and merge data across platforms or work with multiple data pipelines. Once the RevenueCat SDK is integrated, many of these metrics such as active trials, subscriptions, and installs are automatically tracked in the Overview dashboard. If you’re interested in learning more, sign up for a free trial of RevenueCat.
David Barnard is RevenueCat's developer advocate, running all community building and educating initiatives by organizing monthly webinars and hosting the Sub Club podcast, a show on the subscription app business. David also writes and speaks about app development and life in the App Store.
Latest Blog Posts

Related Posts

Featured Posts
