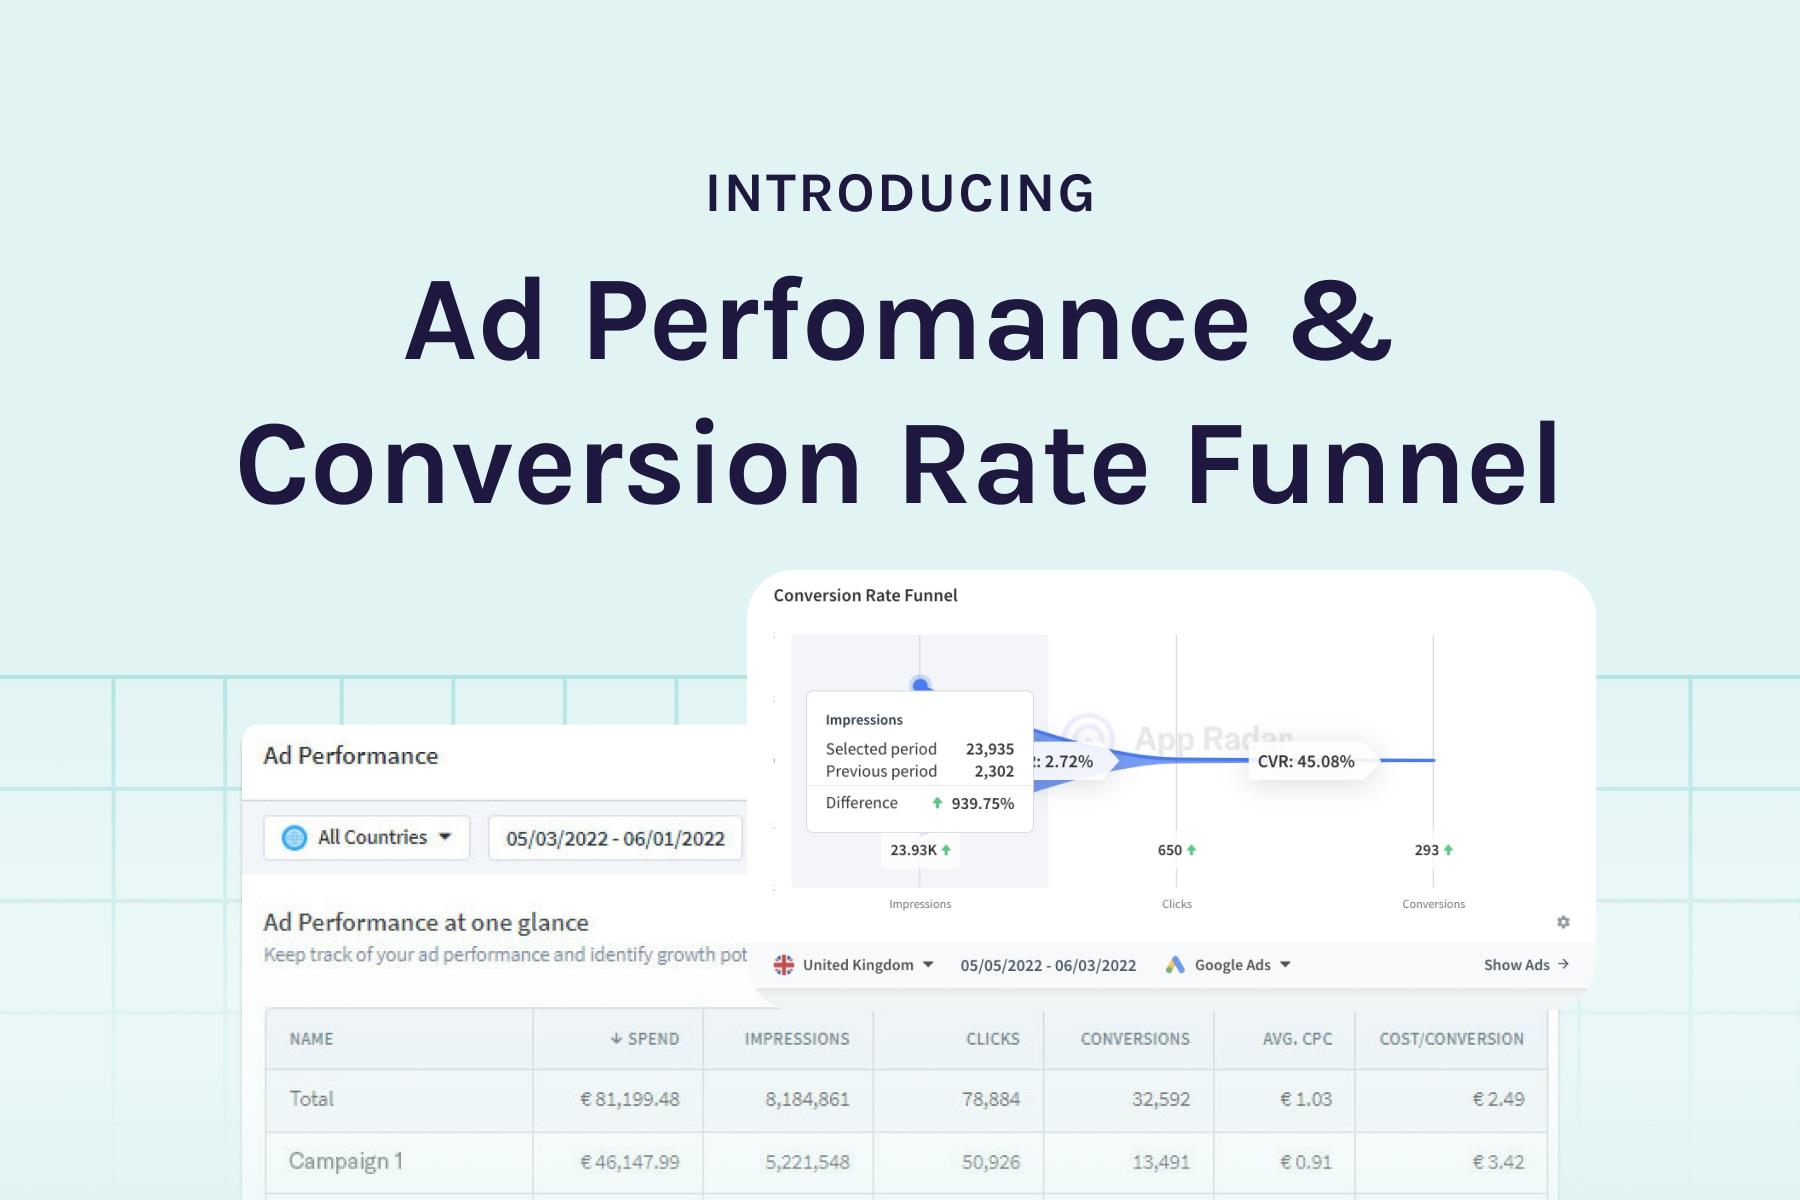
Dive deeper into Google Ads Performance with App Radar
Understanding the impact of paid user acquisition(UA) on the organic acquisition and vice-versa is key to success. However, this might be a challenging task. But, no worries! We’ve got you covered! We added an additional feature that will help you dive deeper into Google Ads Performance data. In this article, we’ll walk you through the most challenging questions about paid and organic UA and show how you can cover those challenges with App Radar’s new Ad Performance feature.
Why do I get a low conversion rate between core ad metrics?
A low or decreasing conversion rate between core ad metrics might look alarming at first sight. But let’s focus on the solution, rather than on the problem.
First, try to understand the root cause of the low conversion rate. Ask yourself the following questions that will help you to analyze the problem:
- In which step of the conversion funnel do users drop off?
- Is it because users are not convinced to click on your ad once they see it?
- Or is it because once users click on your ad, they are not convinced to install your app?
Let’s look at each of those scenarios separately.
Why do my ad impressions not result in clicks?
Yay, you’re getting traction, which means that your ads are being displayed and seen by potential new users of your app or game. But why do they don’t result in clicks?
The conversion rate from clicks to impressions, also known as click-through rate (CTR) is a good option to find out how well your ads are performing.
It is calculated by diving the number of clicks by the number of impressions. In other words, it shows you a ratio of how often people who see your ad also end up clicking it. For example, 1000 impressions and 35 clicks would result in a 3.5% click-through rate (CTR).
If you are seeing a low or decreasing conversion rate from impressions to clicks, it might be a sign that your ads are not relevant or catchy enough for your target audience. People decide within very little time if they click on an ad or not. During that little time span, you need to get their attention.
Another reason could be a change in the budget you spend on your campaigns. If you strongly increased your costs in the selected time period, this will usually lead to a boost in impressions. As a consequence, you might see a lower conversion rate between impressions and clicks due to the extended audience.
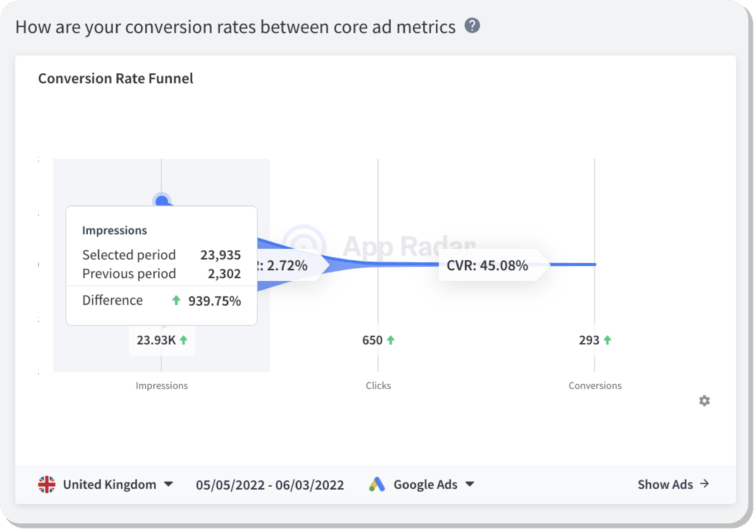
With App Radar all-in-one tool, you will understand where and why users drop off in the funnel. So, you can take measures based on that and improve your performance.
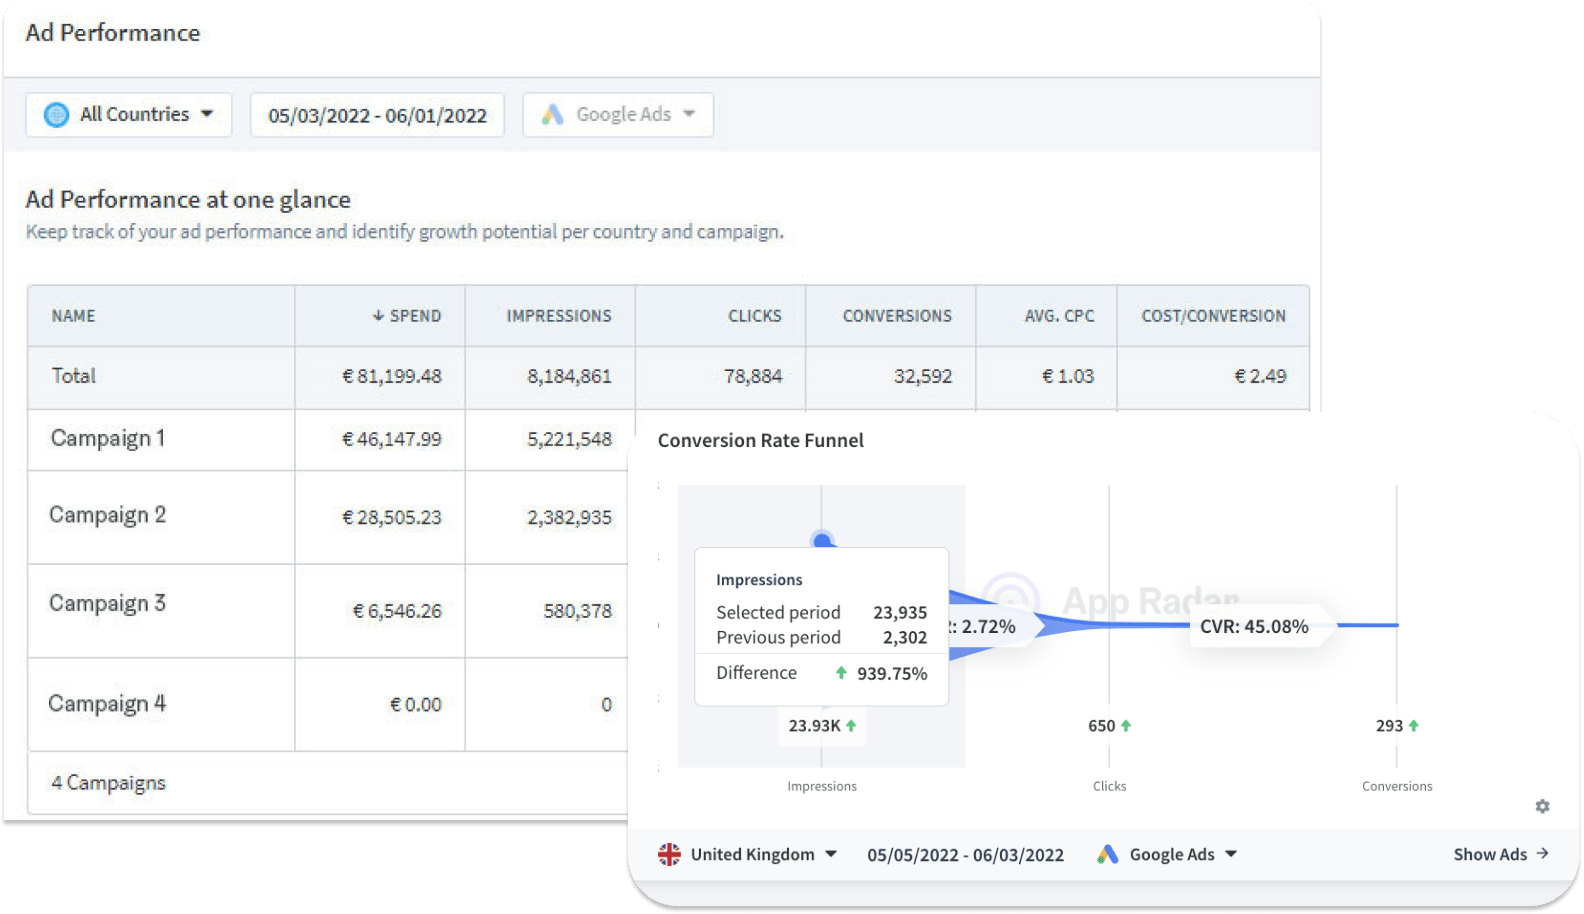
As you can see in the example below, Google App Campaigns in the United Kingdom show a big increase in impressions compared to the previous same time period. In return, this might have lowered the CTR due to more potential users seeing the ad.
As a next step, you should check if you spend more money in the selected time period. In App Radar dashboard, you can keep track of your important ad metrics and compare the performance to the previous period.
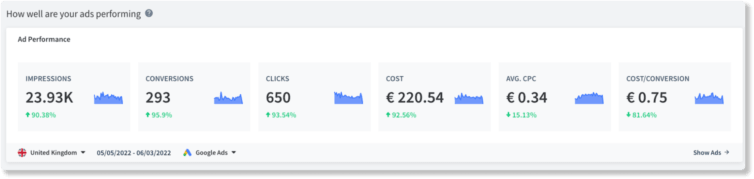
As you can see, the selected time period shows a significant increase in costs, which explains the increase in impressions and the lowered conversion rate from impressions to clicks.
It’s important to remember that ad assets play an important role when it comes to the performance of Google App Campaigns. A low or decreasing conversion rate might be a sign that your ad assets are not convincing enough to make users click on your ad.
What should you do now?
If increased costs were responsible for more impressions and hence lower conversion rate, don’t worry too much about that as long as you get high-quality conversions at an affordable CPI at the end of the funnel.
If you want to improve your conversion rate between impressions and clicks, you should focus on improving your ad assets. Those are the ultimate drivers to improving CTR. Make sure that they are appealing to your target audience and show what makes your app unique. Consider testing different ad text, ad designs and formats. Play around with different wordings that clearly state the value proposition of your app, and test which creatives deliver the best performance.
“With Google App Campaigns, one of the most important and powerful levers for performance is having a pipeline of creatives to continually test, find success, and iterate off of that.”
Christoph Schmied, Head of App Marketing Services Operations at App Radar .
Don’t forget to optimize your organic store listing as parts of it can be also used within your Google App Campaigns. Your app title should be optimized, so that it works for both, your organic store listing and your paid ads.
Keep in mind that conversion rates between ad metrics also get strongly influenced by the app category and country you are in.
Why do my clicks not turn into conversions?
Imagine you have ads that look amazing on the surface. A high amount of clicks confirms that they seem to be appealing to your target audience. But then, once you dive into details, you discover these ad clicks aren’t turning into conversions. Let’s face it, this can be one of the most frustrating experiences for the app UA manager.
Putting a lot of effort into creating outstanding ad assets is one thing. Spending money on users seeing and interacting with those ads is another. But getting those high-quality conversions out of your ad strategy is a whole different story.
Just imagine it like that. You’ve got the attention of your potential customers, they were so convinced that once they saw your ad they didn’t just scroll through. They clicked on it and wanted to know more about your app or game. But then they drop off. And not just a few of those, but a lot. The conclusion here is simple: you're literally losing them in the last step of the install funnel.
Users probably simply didn’t get what they ‘ordered’. Imagine that you go to the restaurant and want to order a pizza margarita for dinner, although the picture in the menu was clearly a pizza margarita, you get a soup instead. Well, you will be most probably disappointed and ask the waiter to return your order. Long story short, no matter if we are talking about a restaurant or downloading an app, expectation management is key.
If users are coming from an ad, but then arrive at a terrible-looking store listing, the chances that they will download the app are rather limited.
What should you do now?
If you see a low or decreasing conversion rate between clicks and conversions, you should focus on improving your organic store listing and double-check the relevance of your ads. Remember, your paid ads, as well as your organic store listing, should be aligned:
- Don’t overpromise within your ad creatives what your app can do. Focus on the in-app experience and benefits your app is really bringing to users. Remember, expectation management is important.
- Align your app’s metadata texts with the messaging you use within your ads. Make sure that important keywords are included in both, organic and paid assets.
- Optimize the creatives in your organic store listing. Focus on showing the in-app experience in an appealing way across your, screenshots, video and feature graphics. Get inspiration for your creatives' optimization by analyzing competitors' store listing visuals across countries in App Radar.
- Work on improving your ratings in the store and regularly reply to users’ reviews. This will give a good impression to other new potential users. Moreover, it will help you build a loyal community and ultimately improve your avg. star rating. We recommend aiming for an average star rating of 4+.
You’ve got 99 problems with analyzing and improving conversion rates between core ad metrics? With App Radar, it's not a problem anymore!
Connect your Google Ads Account with App Radar today and understand where in the funnel users drop off and define measures based on that.
Start Free TrialWhich Google Ads campaign had the biggest impact on my app growth?
After putting a lot of effort into your app user acquisition, most probably you would like to analyze your results and optimize your further performance. So, now it is important to understand what impacts your app's growth, for that reason you need to start answering the following questions:
- Why did my app installs drop last week?
- Was it organic or paid UA traffic?
- Why did installs start increasing?
- Did some Google app campaigns work really well, or did an ASO update have that impact?
- What can I do to improve performance?
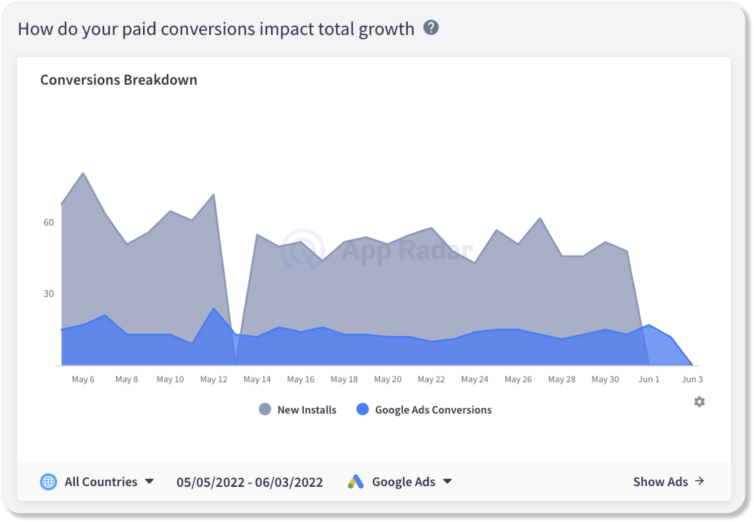
The Conversion Breakdown in App Radar Dashboard can help you find the answer to all those questions. Analyze how your paid conversions impact your total growth and understand whether an increase in installs might be due to reduced Google App Campaigns.
You can find more scenarios with recommended action steps in the article ‘How to grow mobile user acquisition with App Radar’.
Now that you know that your Google app campaigns were responsible for a big part of your conversions, you need to dive deeper to better understand the situation and derive action steps based on that. You might ask yourself:
- Which campaign had the biggest impact on your app growth?
- Which campaign performs best or worst based on important KPIs per campaign and country?
All these questions could be easily answered within our new Ad Performance page.
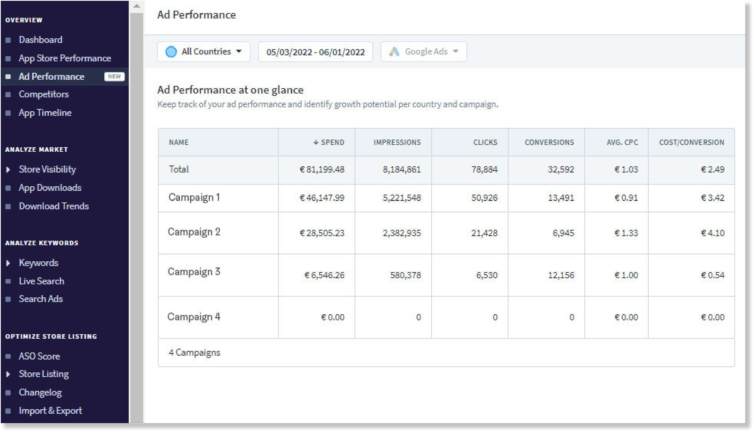
The new Ad Performance page in App Radar helps you understand which campaign and country perform best or worst. Now you can identify growth potential per country and campaign based on important ad performance metrics. Moreover, you can easily filter the campaigns by the KPIs that matter the most to you and compare the performance across different countries.
What should you do now?
Let’s get back to the scenario we covered above about conversion rates between core ad metrics. If you see a low or decreasing conversion rate between core ad metrics, it’s a sign that you should improve something. But where to start?
First, check which country and campaign are impacted. Let’s imagine you are putting a lot of money into campaigns in the United Kingdom. You are getting impressions and clicks, but those campaigns don’t result in the number of conversions you aim to have. This is a sign that your organic store listing is not convincing enough to make users download your app, and you should work on improving it.
Putting time and effort into App Store Optimization (ASO) is one of the biggest drivers that will help you boost also your paid conversions. No need to jump around different tools, simply head over to your store listing editor in the App Radar Tool. From our all-in-one tool, you can implement new keywords and export your new ASO update directly to App Store Connect or Google Play Store.
If you identify campaigns that are having a bad performance, and you are not responsible for running them, check it with the responsible person on how to improve them.
Make sure to double-check countries and campaigns that bring in most of the paid traffic, and boost it further by optimizing also your organic store listing within App Radar.
Final words
Analyzing the impact of paid UA on organic acquisition is not an easy task. You need to look at the install funnel from different angles and ask yourself as many questions as possible. Tools like App Radar can save you time and provide visualized and structured data that will help you to optimize each step of your app install funnel. With our latest feature addition, you can now dive deeper into your Google app campaign's performance, understand the conversion rate between core ad metrics and derive conclusions based on the country and campaign breakdown.
Latest Blog Posts

Related Posts

Featured Posts
