App Radar is getting a facelift
Companies change as they grow, and that’s no different for us.
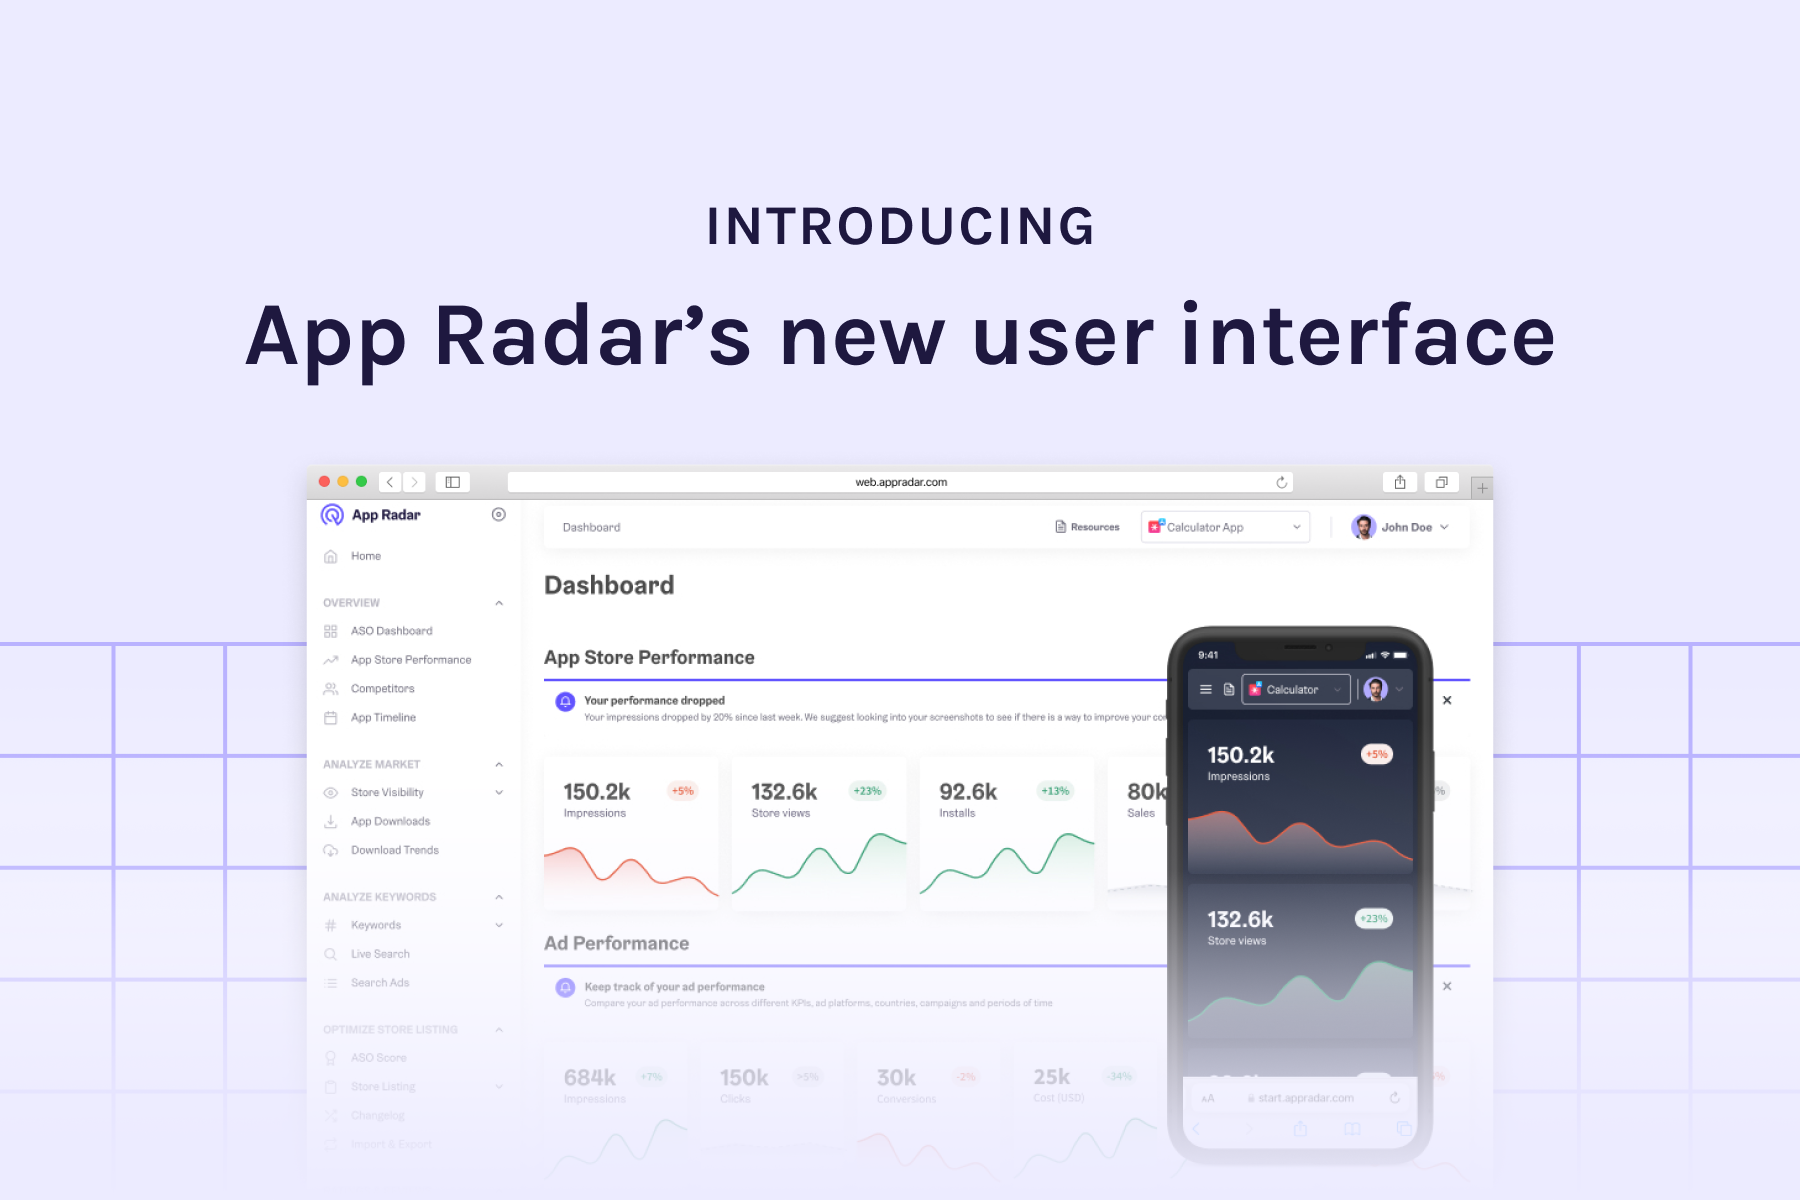
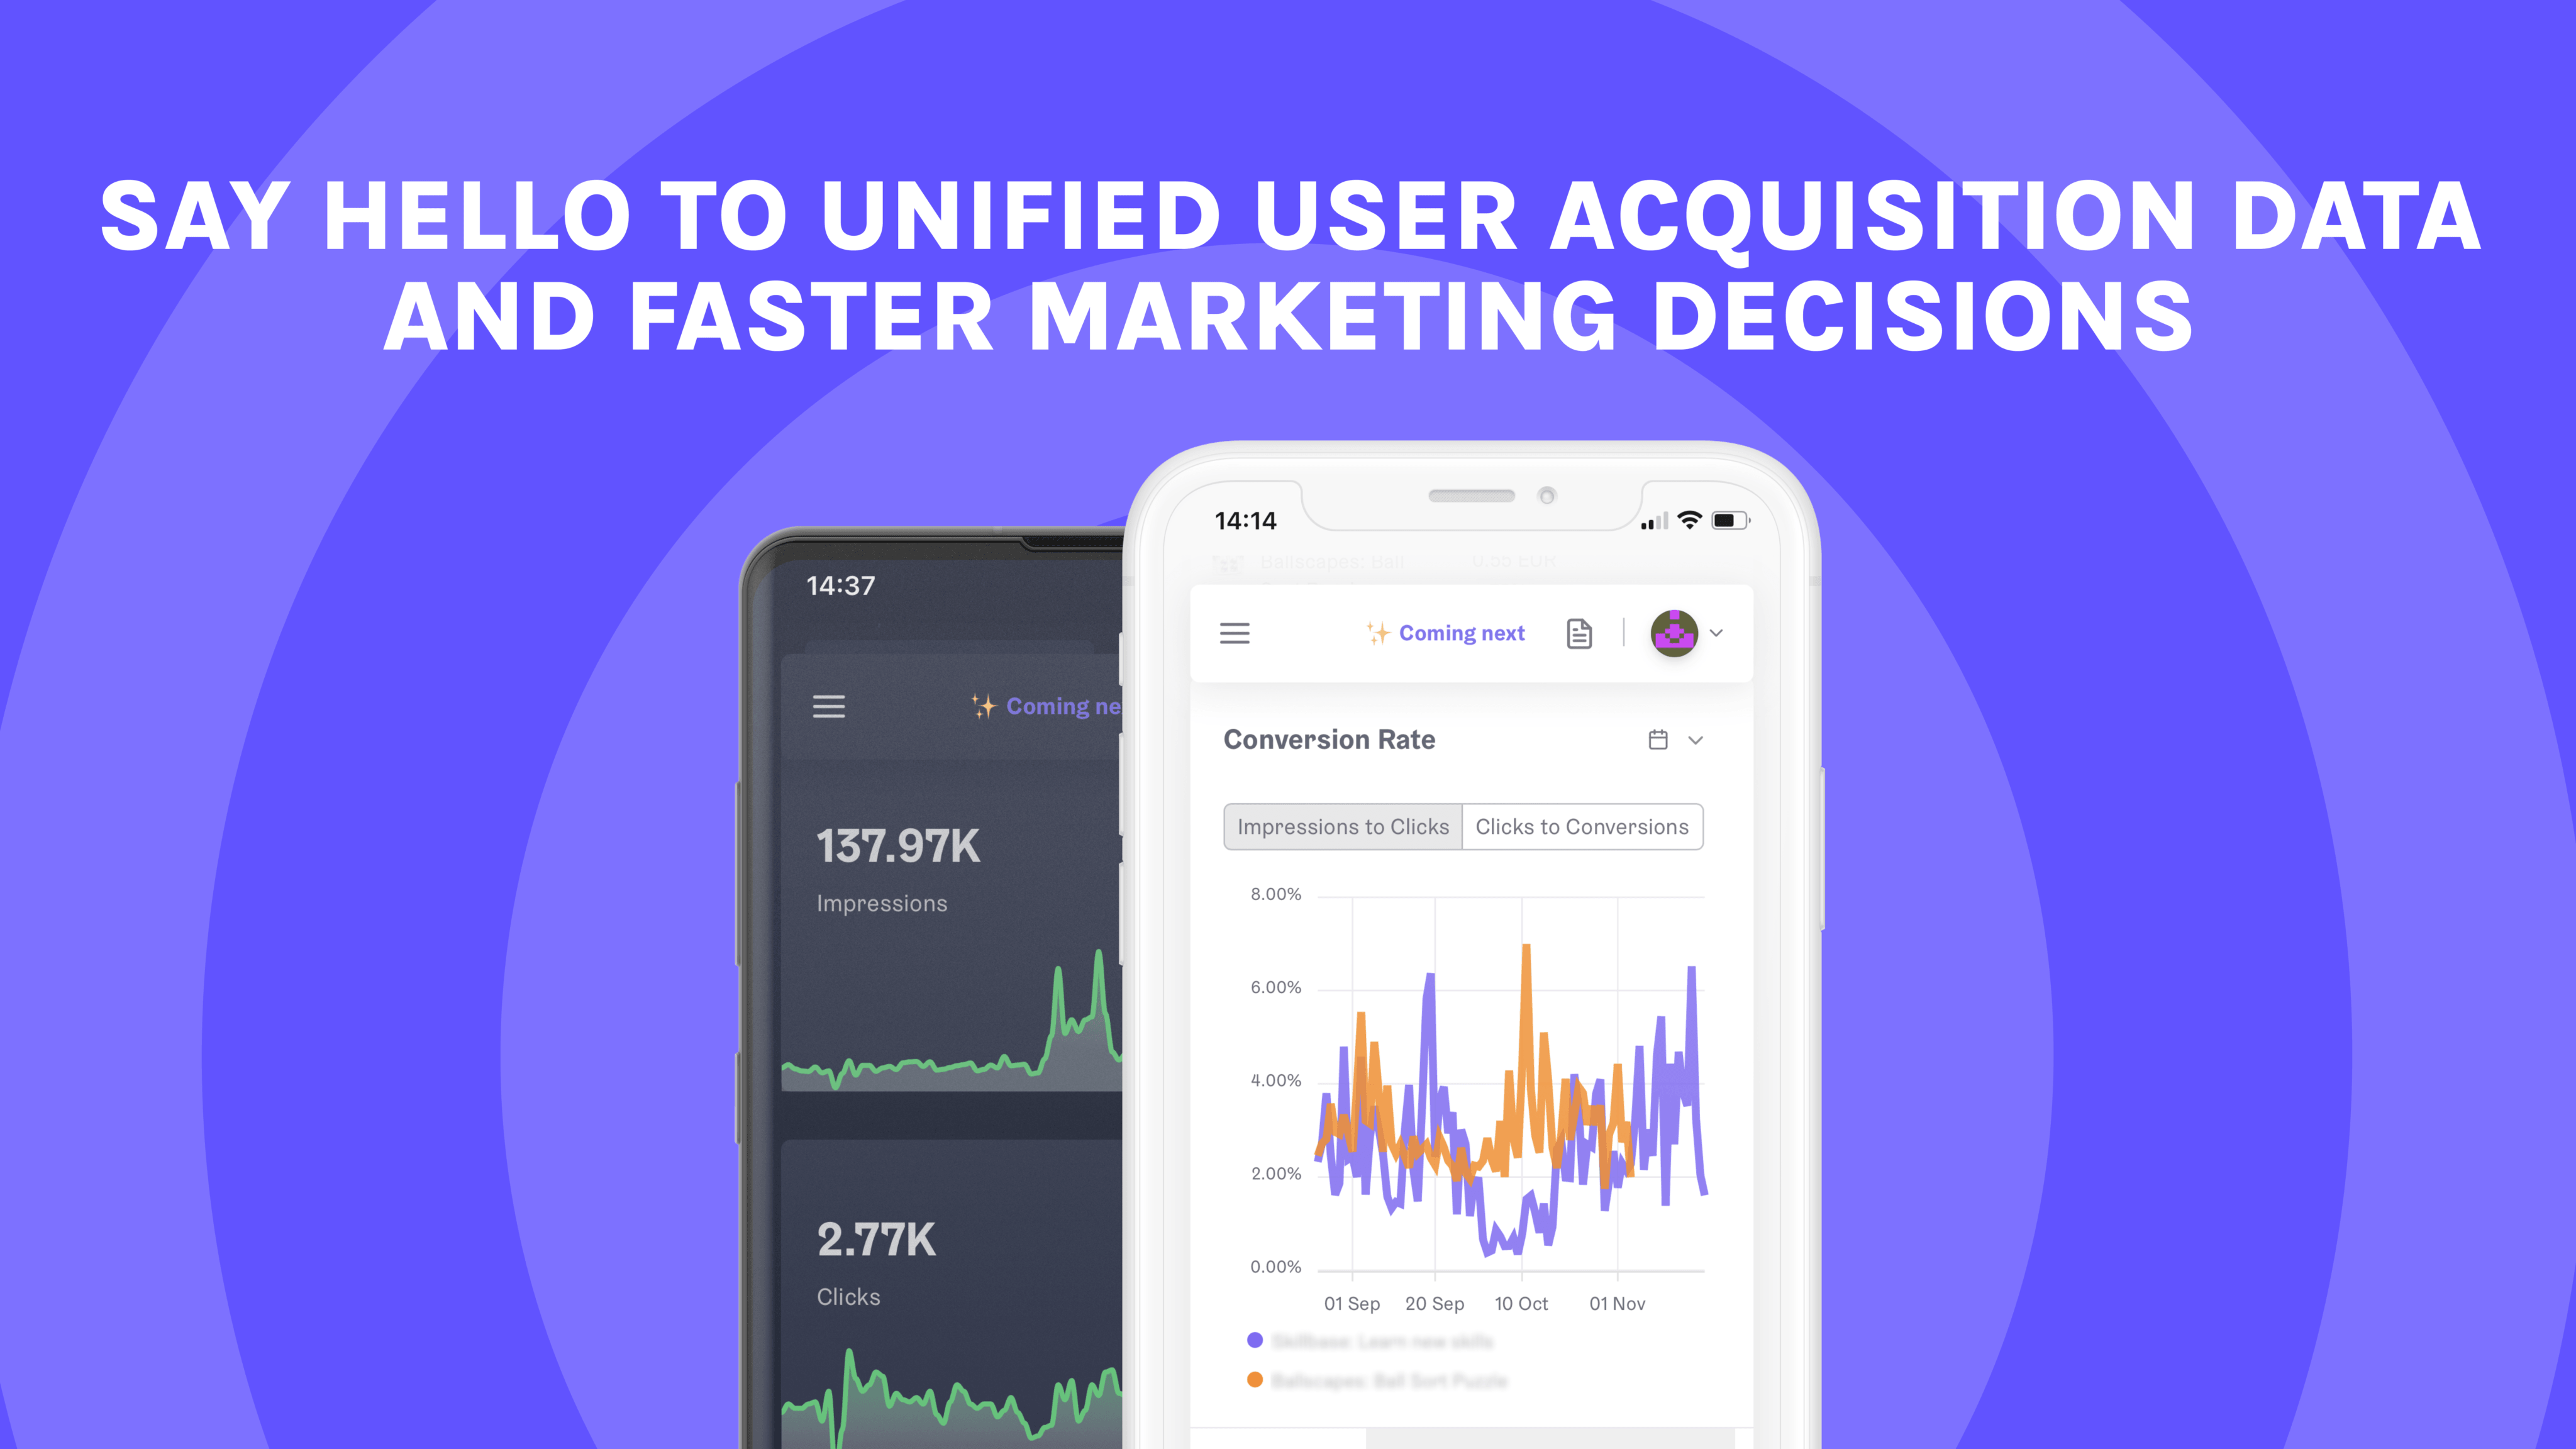
We're excited to announce that App Radar is getting a facelift! We've listened to your feedback and given our app growth platform fresh UI updates. Our team has been working hard to create a more modern and user-friendly interface to help you scale and track your app marketing performance globally. App Radar’s app growth platform is designed to help you work more efficiently within your team and easily navigate through your app performance data.
So let us guide you around the uplifted look of App Radar and give you some hints of what is coming next!
More UI updates - it has to be beautiful, it has to be you!
At App Radar, we care about designing an app growth platform that is intuitive and supports you to work like an expert and to feel confident going after your goals.
We know you work for a global app business. We know you’re responsible for many (sometimes too many) areas, multitasking all day long. We know you work (and chat and order food) on your phone while zipping the coffee (or tea!). We know you hide in the dark mode for the bugs. And you know what? We do this too!
Therefore, we updated App Radar’s interface to consider how you work: your environment is not gray, dull, or boring. But powerful, smart, funny and beautiful!
Our new modern UI enables you to move to the future of mobile marketing with us. Make sure to try out our dark mode as well as to log in on mobile - App Radar is the only app marketing tool providing this flexibility, making sure that you can enjoy working your way.
Get ready to skyrocket your app's growth with our brand-new homepage!
The new homepage on App Radar’s app growth platform is designed to simplify your user experience and provide a more intuitive and guided approach to using our platform. With this modern homepage, app marketers can quickly and easily get started with the App Radar and begin optimizing their app growth strategies right away.
The homepage offers a range of helpful resources:
- tutorial videos that guide users through the platform's key features,
- step-by-step workflows that help streamline common tasks,
- the latest blog posts from our team of experts that will keep you updated about the latest industry news and tips.
Whether you're new to App Radar or our loyal user, the new homepage makes it easy to find the resources you need to succeed. With a few clicks, you can access the information you need to take your app to the next level and achieve your growth goals in no time!
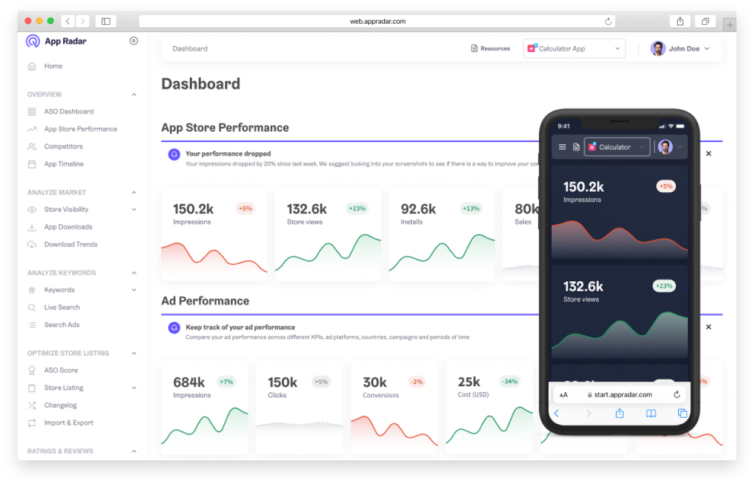
Track your app performance on the go
We know how important it is to track your app's performance, but sometimes, it can be not easy to do so on the go. So we've made it easier than ever for you to do that. Now you can do it from the comfort of your home or on the go. App Radar’s app growth platform is optimized for mobile, so you can easily keep track of your important performance metrics from anywhere.
Introducing dark mode: monitor your app performance in the most convenient way for you
Like most people, you probably spend a lot of time staring at screens. And if you prefer to do so in dim lighting, then you'll be happy to know that App Radar's platform now offers a dark mode option.
Analyze and optimize your app performance in the most convenient way - in light or dark mode.
More productivity: app marketing with AI
App Radar has been at the forefront of AI technology for app marketing, and we're proud to be the first to create AI features specifically designed for this purpose. Our team has put in extensive effort and research, testing hundreds of prompts to find the right ones that are tailored to specific tasks.
AI-powered features have proven to be incredibly effective, with many satisfied customers already seeing results. Here are just a few examples of how App Radar's AI features can help you:
- Ad Copy Generator can help write ad copy for Meta & Google Ads, ensuring that your app is effectively marketed to the right audience. With our intelligent technology, you can rest assured that your ads will be optimized to perform at their best, driving more installs and boosting your app's visibility in the marketplace.
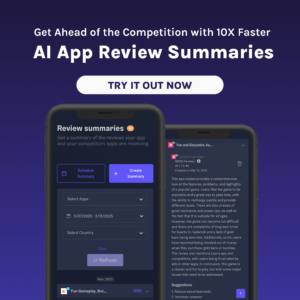
- AI Review Summaries generate a summary of users feedback for any app. This feature can help you stay on top of user reviews, allowing you to quickly identify issues and prioritize improvements. Moreover, you can streamline your review management and competitor analysis with scheduled review summaries.
- AI-powered ASO Score provides you recommendations to optimize your app store listing across all your locations. Our advanced technology evaluates the weight of impact on ranking and provides you with tailored recommendations on how to improve your app's visibility and performance. In other words, with AI-powered ASO Score, you receive updates from high to low priority, making it easy to prioritize the changes that will have the most significant impact.
- Keyword Tracking Suggestions allow you to add to your tracking list relevant keywords to your metadata. You can browse through App Radar’s comprehensive keyword database and get AI-suggested keywords for 70+ countries.
In short, App Radar's AI-powered features are game-changers in the world of app marketing. With our advanced technology, you are able to take your app to the next level, automate manual tasks and save time on more strategic decisions.
With AI App Review Summaries, finding strengths and weaknesses of my clients (and their competitors) apps has become an easy task! It delivers the ChatGPT outputs I’m used to, in a fast and convenient way. Great starting point for ads, copy and screenshot ideation directly from App Radar’s UI!
- Marcus Burke, App Marketing Consultant
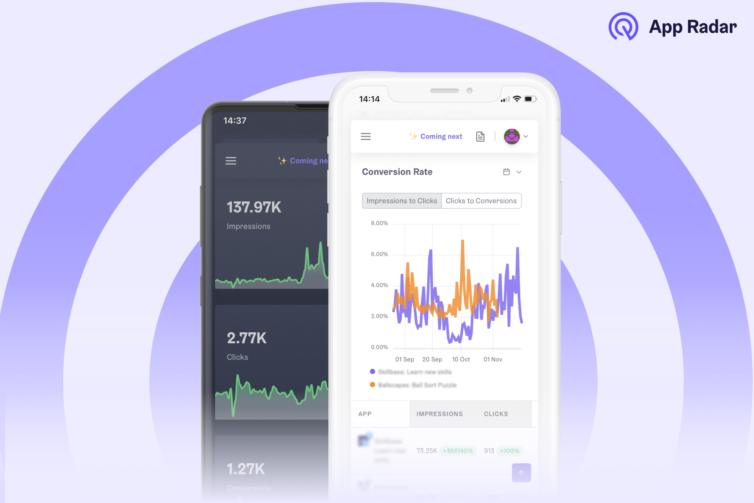
What's next?
During 2022, App Radar has made 28 new product releases, making your App Store Optimization and advertising workflows faster and smarter to maximize your ROI. All our product releases for 2022 are summarized and updated on our website under Release Notes.
In 2023, we’ll be adding functionality that makes App Radar just as powerful, reliable and eye-opening as your morning coffee (or tea!). We couldn’t be more excited!
Analyze, optimize, monitor your app performance with App Radar
Start free trial

Latest Blog Posts

Related Posts

Revolutionize your App Review Management with AI Review Replies
Boost your mobile ad performance with Ad Copy Generator
AI Review Summaries: Get user insights about your and your competitor's apps with a few clicks
How to localize mobile games with ChatGPT: 20 prompts you need to try out
Featured Posts
